How to: Filter Data
This example shows how to create a chart, bind it to a data source and filter series data.
To do this, follow these steps:
Create a chart and add a series. For more information, refer to the following topic: How to Create Series.
Bind the series to data. See the following topic: Populate a series with data from a data source.
Specify the Series.FilterString property to filter series data.
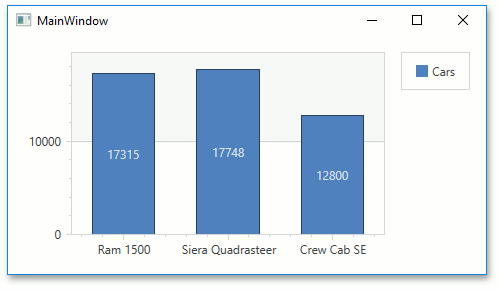
The following image shows a chart with filtered series data. The chart displays the prices of cars whose price is less than $20000 and engine capacity is greater than 2.3 liters.
<dxc:BarSideBySideSeries2D DisplayName="Cars"
ArgumentDataMember="Model"
ValueDataMember="Price"
FilterString="([Price] < 20000) AND ([Liter] > 2.3)">
</dxc:BarSideBySideSeries2D>