2D XY Diagram
- 4 minutes to read
A 2D XY Diagram allows you to visualize data in a Cartesian chart.

Compatible Series Types
You can add the following series to the 2D XY Diagram:
See the following help topic for more information: Series Type Compatibility.
How to: Create a Chart with the 2D XY Diagram
The markup below shows how to create a chart with the BarSideBySideSeries2D and LineSeries2D series (the second series is in a separate pane).
<dxc:ChartControl>
    <!-- The XY diagram's settings. -->
    <dxc:XYDiagram2D>
        <!-- The x-axis settings. -->
        <dxc:XYDiagram2D.AxisX>
            <dxc:AxisX2D GridLinesVisible="True"/>
        </dxc:XYDiagram2D.AxisX>
        <!-- The y-axis settings. -->
        <dxc:XYDiagram2D.AxisY>
            <dxc:AxisY2D GridLinesMinorVisible="True"/>
        </dxc:XYDiagram2D.AxisY>
        <dxc:XYDiagram2D.Panes>
            <dxc:Pane x:Name="pane"/>
        </dxc:XYDiagram2D.Panes>
        <!-- The Side-by-Side Bar series settings. -->
        <dxc:BarSideBySideSeries2D DisplayName="Series 1">
            <dxc:BarSideBySideSeries2D.Model>
                <dxc:BorderlessSimpleBar2DModel/>
            </dxc:BarSideBySideSeries2D.Model>
            <dxc:SeriesPoint Argument="A" Value="5"/>
            <dxc:SeriesPoint Argument="B" Value="2"/>
            <dxc:SeriesPoint Argument="C" Value="4"/>
        </dxc:BarSideBySideSeries2D>
        <!-- The Line series settings. -->
        <dxc:LineSeries2D DisplayName="Series 2"
                          dxc:XYDiagram2D.SeriesPane="{Binding ElementName=pane}">
            <dxc:SeriesPoint Argument="A" Value="7"/>
            <dxc:SeriesPoint Argument="B" Value="3"/>
            <dxc:SeriesPoint Argument="C" Value="2"/>
        </dxc:LineSeries2D>
    </dxc:XYDiagram2D>
    <dxc:ChartControl.Legends>
        <dxc:Legend/>
    </dxc:ChartControl.Legends>
    <dxc:ChartControl.Titles>
        <dxc:Title Content="Cartesian Chart"
                   HorizontalAlignment="Center"/>
    </dxc:ChartControl.Titles>
</dxc:ChartControl>
Related API members:
| Class or Property | Description |
|---|---|
| XYDiagram2D | The 2D XY diagram. |
| XYDiagram2D.AxisX | Contains the X-axis settings. |
| XYDiagram2D.AxisY | Contains the Y-axis settings. |
| XYDiagram2D.Panes | The diagram’s pane collection. |
| BarSideBySideSeries2D | The Side-by-Side Bar series. |
| BarSeries2D.Model | Specifies a series model. |
| SeriesPoint | A series point. |
| LineSeries2D | The Line series. |
| XYDiagram2D.SeriesPane | Specifies a pane that displays a series. This property is an attached property of the XYDiagram2D class. |
| ChartControlBase.Legends | The collection of chart legends. |
| ChartControlBase.Titles | The collection of chart titles. |
Use the following code to access the 2D XY diagram’s options at runtime:
// Cast Diagram to the XYDiagram2D type.
XYDiagram2D diagram = chart.Diagram as XYDiagram2D;
if (diagram != null) {
    // Access diagram properties, for example, rotate the diagram.
    diagram.Rotated = true;
    // Access properties of objects that belong to the diagram,
    // for example, axes.
    diagram.AxisX.Title = new AxisTitle {
        Content = "Date-Time Scale Type"
    };
}
Refer to the following help topic to learn how to populate a chart with data: Providing Data.
The Diagram’s Specific Options
The following options are available:
Secondary X- and Y-axes. Primary and secondary axes can contain additional visual elements: constant lines, axis titles, axis labels, scale breaks, and strips.
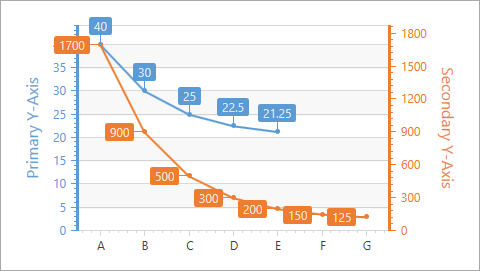
See the following help topic for more information: Secondary Axes.
Multiple panes that can be stacked to each other horizontally or vertically. Use the XYDiagram2D.DefaultPane property to access the default pane. To add panes to the diagram, populate the XYDiagram2D.Panes collection with Pane objects. See the following help topic for more information: Panes.
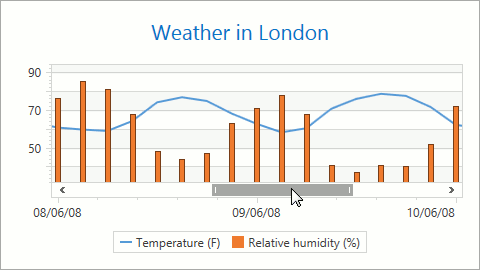
Zoom and scroll. Use the XYDiagram2D.EnableAxisXNavigation and XYDiagram2D.EnableAxisYNavigation properties to allow users to zoom and scroll a chart. The following help topic describes zoom and scroll operations in greater detail: Zoom and Scroll in 2D XY-Charts.
Swap axes. Use the XYDiagram2D.Rotated property to rotate the diagram. When the Rotated property is set to true, the X-axis is displayed vertically, and the Y-axis is displayed horizontally.
The property value The resulting image XYDiagram2D.Rotated = false 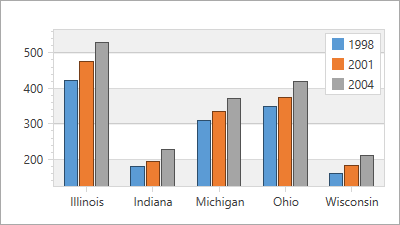
XYDiagram2D.Rotated = true 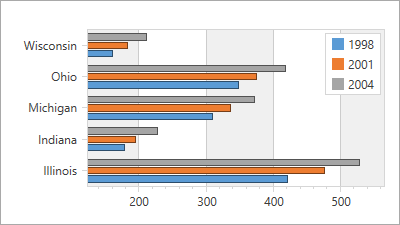
Customize Diagram Appearance
The following appearance customization properties are available:
- Background
- BorderBrush
- BorderThickness
- FontFamily
- FontSize
- FontStretch
- FontStyle
- FontWeight
- Margin
- Padding
Use the XYDiagram2D.DefaultPane property to specify appearance settings for the default diagram pane.
The following example hides the diagram border, specifies paddings and margins, changes the font style, and makes the diagram transparent:
<dxc:ChartControl Background="{x:Null}">
    <dxc:XYDiagram2D  BorderThickness="0" Padding="10" Margin="10"  FontStyle="Italic" >
        <dxc:XYDiagram2D.DefaultPane>
            <dxc:Pane DomainBrush="Transparent" />
        </dxc:XYDiagram2D.DefaultPane>
        <!--...-->
    </dxc:XYDiagram2D>
</dxc:ChartControl>