Trend Indicators
- 2 minutes to read
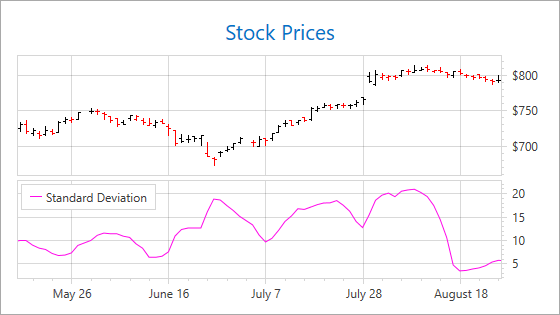
Trend Indicators show the tendency of series values to move in a specific direction over time. Trend indicators are commonly used with financial charts.
This document contains the following sections:
Available Trend Indicators
The Chart control supports the following Trend indicators:
Trend indicator | Class | Specific parameters |
|---|---|---|
Bollinger Bands | ||
Mass Index | ||
Standard Deviation |
How to Add a Trend Indicator
You can position the Standard Deviation and Mass Index indicators in a separate pane with a secondary y-axis. The following XAML shows how to add the Standard Deviation Indicator:
<dxc:ChartControl>
    <!--...-->
    <dxc:XYDiagram2D>
        <!--...-->
        <dxc:StockSeries2D DisplayName="Series">
            <dxc:StockSeries2D.Indicators>
                <dxc:StandardDeviation PointsCount="14"
                                       ValueLevel="Close"
                                       dxc:XYDiagram2D.IndicatorPane="{Binding ElementName=indicatorPane}"
                                       dxc:XYDiagram2D.IndicatorAxisY="{Binding ElementName=indicatorAxisY}"
                                       Legend="{Binding ElementName=indicatorLegend}"
                                       LegendText="Standard Deviation"
                                       ShowInLegend="True"/>
            </dxc:StockSeries2D.Indicators>
            <!--...-->
        </dxc:StockSeries2D>
        <dxc:XYDiagram2D.Panes>
            <dxc:Pane x:Name="indicatorPane"/>
        </dxc:XYDiagram2D.Panes>
        <dxc:XYDiagram2D.SecondaryAxesY>
            <dxc:SecondaryAxisY2D x:Name="indicatorAxisY"
                                  Alignment="Far">
                <dxc:SecondaryAxisY2D.WholeRange>
                    <dxc:Range dxc:AxisY2D.AlwaysShowZeroLevel="False"/>
                </dxc:SecondaryAxisY2D.WholeRange>
            </dxc:SecondaryAxisY2D>
        </dxc:XYDiagram2D.SecondaryAxesY>
    </dxc:XYDiagram2D>
</dxc:ChartControl>
The following table lists classes and properties used to add the Standard Deviation indicator to a chart:
| Class or Property | Description |
|---|---|
| XYSeries2D.Indicators | The series collection of indicators. |
| StandardDeviation | The Standard Deviation indicator. |
| StandardDeviation.PointsCount | The number of series points used to build the indicator. |
| StandardDeviation.ValueLevel | Specifies the point value used to calculate the indicator. |
| XYDiagram2D.IndicatorPane | Specifies the pane that contains the indicator. |
| XYDiagram2D.IndicatorAxisY | Specifies the y-axis used with the indicator. |
| Indicator.Legend | Specifies the legend that displays the legend. |
| Indicator.LegendText | The text that shows with the identifier marker in the legend. |
| Indicator.ShowInLegend | Specifies whether to show the indicator in the legend. |
See Also