Oscillator Indicators
- 2 minutes to read
Any financial series within the Chart Control can be accompanied with an unlimited number of different Oscillators. An oscillator is a trend indicator banded between two extreme values used to discover short-term overbought or oversold conditions.
This document consists of the following sections:
Available Oscillator Indicators
The following table lists all the Oscillator indicators supported by the Chart Control:
Oscilllator indicator | Class | Specific Parameters |
|---|---|---|
Average True Range, ATR | ||
MovingAverageConvergenceDivergence.ValueLevel MovingAverageConvergenceDivergence.SignalSmoothingPeriod | ||
Rate of Change, RoC | ||
Chaikin’s Volatility, CHV | ||
How to Add an Oscillator Indicator to a Chart
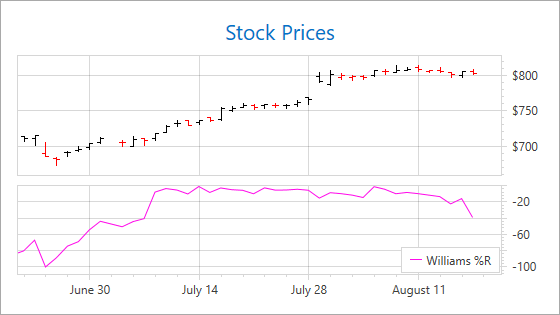
The following XAML shows how to add the Williams %R indicator to a separate pane with a secondary Y-axis:
<dxc:StockSeries2D DisplayName="Series">
    <dxc:StockSeries2D.Indicators>
        <dxc:WilliamsR PointsCount="15"
                       dxc:XYDiagram2D.IndicatorPane="{Binding ElementName=indicatorPane}"
                       dxc:XYDiagram2D.IndicatorAxisY="{Binding ElementName=indicatorAxis}"
                       LegendText="Williams %R"
                       ShowInLegend="True"/>
    </dxc:StockSeries2D.Indicators>
    <!--...-->
</dxc:StockSeries2D>
<dxc:XYDiagram2D.Panes>
    <dxc:Pane x:Name="indicatorPane"/>
</dxc:XYDiagram2D.Panes>
<dxc:XYDiagram2D.SecondaryAxesY>
    <dxc:SecondaryAxisY2D x:Name="indicatorAxis"
                          Alignment="Far"/>
</dxc:XYDiagram2D.SecondaryAxesY>
The markup above uses the following classes and properties:
| Class or Property | Description |
|---|---|
| XYSeries2D.Indicators | The series collection of indicators. |
| WilliamsR | The Williams %R indicator. |
| WilliamsR.PointsCount | The number of series points that are used to build the indicator. |
| XYDiagram2D.IndicatorPane | The indicator pane. |
| XYDiagram2D.IndicatorAxisY | The y-axis for the indicator. |
| Indicator.LegendText | The text that identifies the indicator within the legend of the Chart Control. |
| Indicator.ShowInLegend | Specifies whether to show the indicator in the legend. |