Indicators
- 5 minutes to read
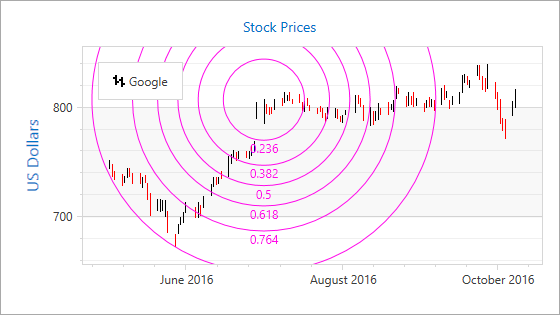
Indicators are special metrics that are commonly used to analyze and process financial data visually.
The image demonstrates the FibonacciArcs indicator that is calculated using two financial series points’ values.
This document consists of the following sections:
- Available Indicators
- How to Add an Indicator to a Series
- How to Plot Indicator on a Separate Pane
- How to Customize Indicator Appearance
Available Indicators
You can display any number of built-in indicators for the 2D XY Diagram series. The Chart control provides the following indicators:
How to Add an Indicator to a Series
In this section, you add a Fibonacci Retracement indicator that is shown in the following image:
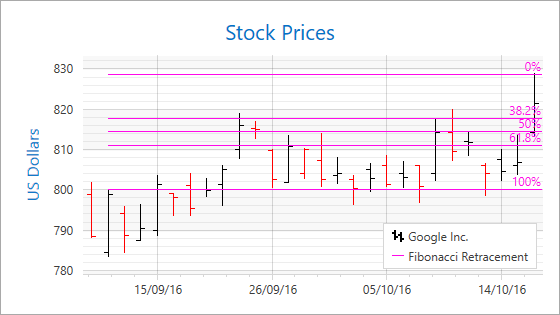
Specify two points’ argument and value levels to add the Fibonacci Retracement indicator to the chart. Note that other indicators can require defining other specific parameters.
<dxc:StockSeries2D DisplayName="series">
      <dxc:StockSeries2D.Indicators>
            <dxc:FibonacciRetracement Argument1="09/12/2016"
                                      ValueLevel1="High"
                                      Argument2="10/18/2016"
                                      ValueLevel2="High"
                                      LegendText="Fibonacci Retracement"
                                      ShowInLegend="True"/>
      </dxc:StockSeries2D.Indicators>
      <!--...-->
</dxc:StockSeries2D>
The markup above uses the following classes and properties:
| Class or Property | Description |
|---|---|
| XYSeries2D.Indicators | The series indicators’ collection. |
| FibonacciRetracement | The Fibonacci Retracement indicator. |
| FinancialIndicator.Argument1 | Specifies the first indicator point’s argument. |
| FinancialIndicator.ValueLevel1 | Specifies the first indicator point’s value level. |
| FinancialIndicator.Argument2 | Specifies the second indicator point’s argument. |
| FinancialIndicator.ValueLevel2 | Specifies the second indicator point’s value level. |
| Indicator.LegendText | Text that is shown with an indicator marker in a legend. |
| Indicator.ShowInLegend | Specifies the value indicating whether to show an indicator in a chart legend. |
How to Plot an Indicator on a Separate Pane
Indicators that are SeparatePaneIndicator class descendants can be plotted on a separate pane with a secondary y-axis. Below is the list of these indicators:
- Average True Range (AverageTrueRange)
- Chaikin’s Volatility (ChaikinsVolatility)
- Commodity Channel Index (CommodityChannelIndex)
- Detrended Price Oscillator DetrendedPriceOscillator
- Mass Index (MassIndex)
- Moving Average Convergence/Divergence (MovingAverageConvergenceDivergence)
- Rate of Change (RateOfChange)
- Relative Strength Index (RelativeStrengthIndex)
- Standard Deviation (StandardDeviation)
- Triple Exponential Moving Average oscillator (TripleExponentialMovingAverageTrix)
- Williams %R (WilliamsR)
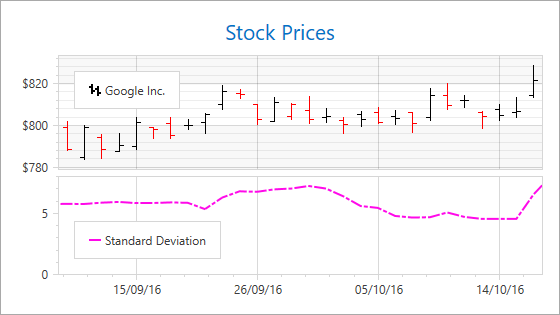
The following image shows the Standard Deviation indicator in a separate chart pane:
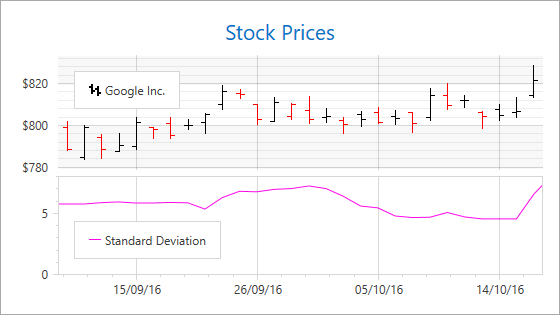
Use the following code to draw an indicator in a separate pane with a secondary axis:
<dxc:ChartControl.Legends>
    <dxc:Legend x:Name="legend"/>
</dxc:ChartControl.Legends>
<dxc:XYDiagram2D>
    <dxc:XYDiagram2D.SecondaryAxesY>
        <dxc:SecondaryAxisY2D x:Name="secondaryAxis"
                              Alignment="Far"/>
    </dxc:XYDiagram2D.SecondaryAxesY>
    <dxc:XYDiagram2D.Panes>
        <dxc:Pane x:Name="pane"/>
    </dxc:XYDiagram2D.Panes>
    <!-- ... -->
    <dxc:StockSeries2D.Indicators>
          <dxc:StandardDeviation  dxc:XYDiagram2D.IndicatorAxisY="{Binding ElementName=secondaryAxis}"
                                  dxc:XYDiagram2D.IndicatorPane="{Binding ElementName=pane}"
                                  ValueLevel="High"
                                  Legend="{Binding ElementName=legend}"
                                  LegendText="Standard Deviation"
                                  ShowInLegend="True"/>
    </dxc:StockSeries2D.Indicators>
    <!--...-->
</dxc:XYDiagram2D>
The markup above uses the following classes and properties:
| Class or Property | Description |
|---|---|
| StandardDeviation | The StandardDeviation indicator. |
| XYDiagram2D.IndicatorPane | The pane that displays an indicator. |
| XYDiagram2D.IndicatorAxisY | The y-axis to which an indicator is bound. |
| Indicator.Legend | The legend that shows the indicator’s designation. |
| Indicator.LegendText | Text that identifies an indicator in a legend. |
| Indicator.ShowInLegend | Specifies whether to show an indicator in a legend. |
How to Customize Indicator Appearance
You can create a custom color palette to draw indicators instead of the DefaultIndicatorsPalette.
Use the following XAML to configure a custom palette:
<dxc:ChartControl.IndicatorsPalette>
        <dxc:CustomIndicatorsPalette>
                <dxc:CustomIndicatorsPalette.Colors>
                         <Color>Blue</Color>
                         <Color>Green</Color>
                </dxc:CustomIndicatorsPalette.Colors>
        </dxc:CustomIndicatorsPalette>
</dxc:ChartControl.IndicatorsPalette>
The markup above uses the following classes and properties:
| Class or Property | Description |
|---|---|
| ChartControl.IndicatorsPalette | Provides access to the palette applied to indicators. |
| CustomIndicatorsPalette | The custom colors’ palette. |
| CustomIndicatorsPalette.Colors | The palette’s collection of colors. |
| Color | The palette color. |
Note
You can specify a color for each indicator using the Indicator.Brush property.
Also, modify a style of a line that is used to draw an indicator.
For this, use the following code:
<dxc:StockSeries2D.Indicators>
      <dxc:StandardDeviation dxc:XYDiagram2D.IndicatorAxisY="{Binding ElementName=secAxis}"
                             dxc:XYDiagram2D.IndicatorPane="{Binding ElementName=pane}"
                             ValueLevel="High"
                             Legend="{Binding ElementName=indicatorLegend}"
                             LegendText="Standard Deviation"
                             ShowInLegend="True">
            <dxc:StandardDeviation.LineStyle>
                  <dxc:LineStyle Thickness="2">
                        <dxc:LineStyle.DashStyle>
                              <DashStyle Dashes="2 1 2"/>
                        </dxc:LineStyle.DashStyle>
                  </dxc:LineStyle>
            </dxc:StandardDeviation.LineStyle>
      </dxc:StandardDeviation>
</dxc:StockSeries2D.Indicators>
The code above uses the following classes and properties to configure a line:
| Class or Property | Description |
|---|---|
| Indicator.LineStyle | Specifies the line style settings. |
| LineStyle | Line style’s settings. |
| LineStyle.DashStyle | Specifies the dash style settings. |