Axis Scale Types
- 5 minutes to read
An axis’s scale type is based on a series scale type and defines how an axis interprets point arguments and data values. The ScaleType enumeration lists available scale types: Numerical, Date-Time, Qualitative, and Auto (This mode automatically determines the arguments axis’s scale based on underlying data).
This document consists of the following sections:
Numerical Scale Type
The Numerical Scale Type represents the series points’ values or arguments as numbers on an axis. You can specify the Numerical scale by setting the Series.ArgumentScaleType or Series.ValueScaleType property to ScaleType.Numerical, and reduce the number of points by aggregating numeric values. Refer to the Data Aggregation topic for more details.
The following example shows how to configure the y-axis’s scale options:
<dxc:XYDiagram2D.AxisY>
    <dxc:AxisY2D>
        <dxc:AxisY2D.NumericScaleOptions>
            <dxc:ContinuousNumericScaleOptions AutoGrid="False"
                                               GridAlignment="2"
                                               GridSpacing="100"/>
        </dxc:AxisY2D.NumericScaleOptions>
    </dxc:AxisY2D>
</dxc:XYDiagram2D.AxisY>
The following table contains classes and properties that configure numeric scale options:
| Class or Property | Description |
|---|---|
| AxisX2D.NumericScaleOptions | Gets or sets a numeric x-axis scale’s behavior options when its mode is manual, automatic or continuous. |
| AxisY2D.NumericScaleOptions | Specifies options that define a numeric y-axis scale’s behavior when its mode is manual, automatic or continuous. |
| AxisX3D.NumericScaleOptions | Gets or sets a 3D numeric x-axis scale’s behavior settings when its mode is manual, automatic or continuous. |
| AxisY3D.NumericScaleOptions | Specifies the options that define a 3D numeric y-axis scale’s behavior when its mode is manual, automatic or continuous. |
| CircularAxisX2D.NumericScaleOptions | Provides access to the options that define a numeric circular x-axis scale’s behavior when its mode is manual, automatic or continuous. |
| CircularAxisY2D.NumericScaleOptions | Gets or sets the options that define a numeric circular y-axis scale’s behavior when its mode is manual, automatic or continuous. |
| AutomaticNumericScaleOptions | Stores a numeric axis’s options when its scale mode is automatic. |
| ContinuousNumericScaleOptions | Contains a numeric axis’s settings when its scale mode is continuous. |
| ManualNumericScaleOptions | Stores a numeric axis’s settings when its scale mode is manual. |
How to Enable Logarithmic Scale
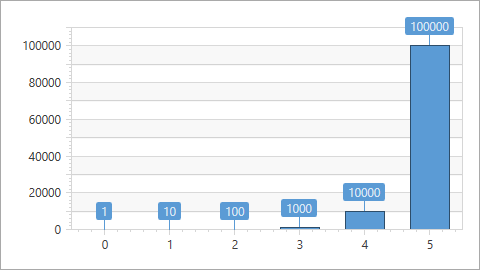
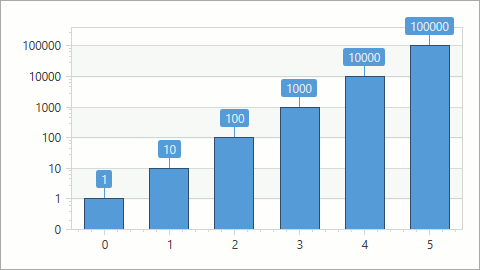
You can display numeric values using a logarithmic scale. When the Logarithmic scale is enabled, the GridSpacing property value is rounded to integer values. The following image demonstrates a logarithmic axis:
| Axis.Logarithmic = false | Axis.Logarithmic = true |
|---|---|
 |
 |
Use the following markup to configure a logarithmic view for a numerical axis:
<dxc:XYDiagram2D.AxisY>
    <dxc:AxisY2D Logarithmic="True"
                 LogarithmicBase="10"/>
</dxc:XYDiagram2D.AxisY>
The following table lists properties allowing to configure a logarithmic axis:
| Property | Description |
|---|---|
| Axis.Logarithmic | Gets or sets whether the axis should display its numerical values using a logarithmic scale. |
| Axis.LogarithmicBase | Gets or sets a value specifying a logarithmic base when the Logarithmic property is enabled. |
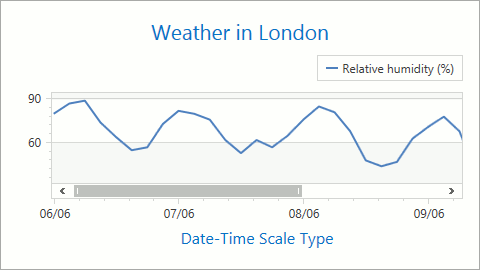
Date-Time Scale Type
The Date-Time Scale Type represents the series points’ values or arguments as date-time values on an axis. You can manually specify the Date-Time scale by setting the Series.ArgumentScaleType or Series.ValueScaleType property to ScaleType.DateTime. You can reduce the number of points by aggregating date-time values. Refer to the Data Aggregation topic to learn more. To exclude holidays and non-working days from a date-time scale, refer to Work Time and Workday Configuration.
The following image demonstrates a date-time scale:
The markup below shows how to specify a Date-Time axis’s scale settings:
<dxc:XYDiagram2D.AxisX>
    <dxc:AxisX2D>
        <dxc:AxisX2D.DateTimeScaleOptions>
            <dxc:ManualDateTimeScaleOptions AutoGrid="False"
                                            MeasureUnit="Day"
                                            GridAlignment="Week"
                                            GridSpacing="3"
                                            WorkdaysOnly="True"
                                            GridOffset="-2">
            </dxc:ManualDateTimeScaleOptions>
        </dxc:AxisX2D.DateTimeScaleOptions>
    </dxc:AxisX2D>
</dxc:XYDiagram2D.AxisX>
The following table contains the classes and properties required to configure date-time axis options:
| Class or Property | Description |
|---|---|
| AxisX2D.DateTimeScaleOptions | Gets or sets the x-axis scale’s behavior options when its mode is manual, automatic or continuous. |
| AxisY2D.DateTimeScaleOptions | Specifies the y-axis scale’s behavior options when its mode is manual, automatic or continuous. |
| AxisX3D.DateTimeScaleOptions | Gets or sets a 3D date-time x-axis scale’s behavior settings when its mode is manual, automatic or continuous. |
| AxisY3D.DateTimeScaleOptions | Specifies the options that define a 3D date-time y-axis scale’s behavior when its mode is manual, automatic or continuous. |
| CircularAxisY2D.DateTimeScaleOptions | Gets or sets the options that define the date-time circular y-scale’s behavior when its mode is continuous. |
| AutomaticDateTimeScaleOptions | Stores a date-time axis’s options when its scale mode is automatic. |
| ContinuousDateTimeScaleOptions | Contains a date-time axis’s settings when its scale mode is continuous. |
| ManualDateTimeScaleOptions | Stores a date-time axis’s settings when its scale mode is manual. |
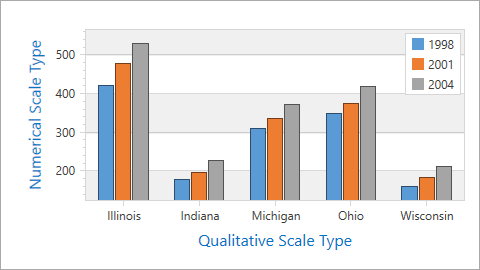
Qualitative Scale Type
The Qualitative Scale Type represents series point arguments as textual values (for example, A, B, C, X, XII, etc.). You can manually specify the Qualitative scale by setting the Series.ArgumentScaleType property to ScaleType.Qualitative. Note that an arguments axis can only use this scale type. Use the QualitativeScaleOptions.AggregateFunction property to specify a function that is used to aggregate data associated with a qualitative axis.
The markup below shows how to configure a qualitative scale’s options:
<dxc:XYDiagram2D.AxisX>
    <dxc:AxisX2D TickmarksMinorVisible="False">
        <dxc:AxisX2D.QualitativeScaleOptions>
            <dxc:QualitativeScaleOptions AutoGrid="False"
                                         GridSpacing="1"/>
        </dxc:AxisX2D.QualitativeScaleOptions>
    </dxc:AxisX2D>
</dxc:XYDiagram2D.AxisX>
The following table lists classes and properties that allow you to specify a qualitative scale’s options:
| Class or Property | Description |
|---|---|
| AxisX2D.QualitativeScaleOptions | Gets or sets the options that define the behavior of a 2D x-axis’s scale when its type is qualitative. |
| AxisX3D.QualitativeScaleOptions | Specifies the settings that define the behavior of a 3D x-axis’s scale when its type is qualitative. |
| RadarAxisX2D.QualitativeScaleOptions | Gets or sets the options that specify the behavior of a Radar x-axis’s scale when its type is qualitative. |
| QualitativeScaleOptions | The qualitative scale options’ settings. |
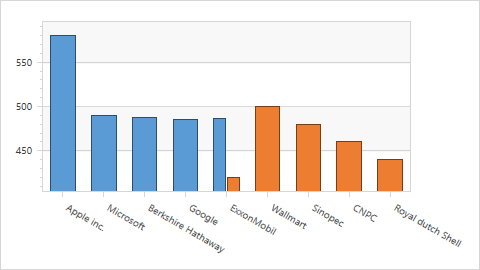
The following images show how a qualitative axis works with various qualitative series points’ arguments:
Qualitative arguments follow one after another when series have different qualitative arguments:
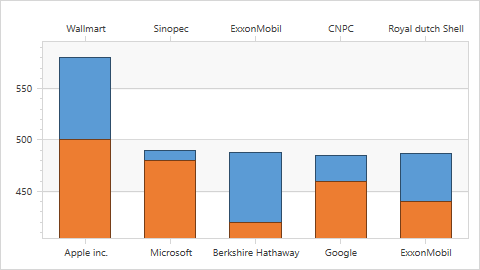
Series overlap when one of series uses a secondary axis:
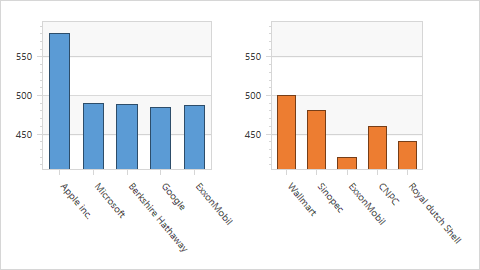
You can plot a series in a separate pane to resolve overlapping series:
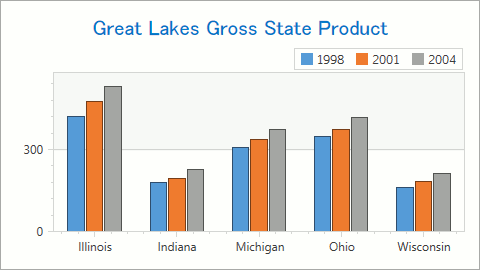
Different series’ points are grouped by equal string arguments:
How to Sort Qualitative Axis Values
Assign an object implementing the IComparer interface to the AxisBase.QualitativeScaleComparer property to specify a custom qualitative scale value order.
Example: How to: Sort Qualitative Scale Values in a Custom Sort Order