Whole and Visual Ranges
- 6 minutes to read
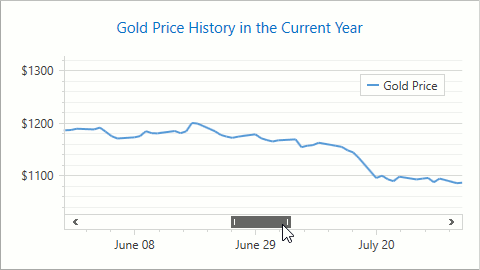
Whole and visual axis ranges define which data an axis displays. The whole range is automatically calculated based on the data of all series associated with the axis. A chart does not show values that are outside the range. A visual range is equal to a whole range by default and determines the data range the Chart control currently displays.
| An x-axis’s visual range is equal to a whole range | An x-axis’s visual range is less than a whole range |
|---|---|
 |
 |
The following axes types allow you to operate with their whole or visual ranges:
- A whole range is available for Axis and CircularAxisY2D class descendants, and the RadarAxisX2D class object.
- A visual range is available for Axis2D class descendants.
How End User Can Change a Visual Range
An end user changes a visual range when zooming and scrolling a chart. Note that changing the visual range does not affect the whole range.
Use the markup below to enable scrolling and zooming in a chart:
<dxc:XYDiagram2D EnableAxisXNavigation="True"
                 EnableAxisYNavigation="True">
<!--...-->
</dxc:XYDiagram2D>
How to Exclude Axis Ranges Without Points
Enable the DateTimeAggregationScaleOptionsBase.SkipRangesWithoutPoints property to exclude all date-time axis ranges without data points.
SkipRangesWithoutPoints = true | SkipRangesWithoutPoints = false (Default) |
|---|---|
|
|


<dxc:XYDiagram2D.AxisX>
    <dxc:AxisX2D>
        <dxc:AxisX2D.DateTimeScaleOptions>
            <dxc:ManualDateTimeScaleOptions SkipRangesWithoutPoints="True"/>
        </dxc:AxisX2D.DateTimeScaleOptions>
    </dxc:AxisX2D>
</dxc:XYDiagram2D.AxisX>
How to Configure Visual and Whole Ranges
The chart control calculates minimum and maximum axis range limits based on the corresponding argument and value data of all series in the chart. To disable automatic range calculation, you can use the MinValue and MaxValue properties to explicitly specify range limits:
<!--...-->
<dxc:XYDiagram2D.AxisX>
    <dxc:AxisX2D>
        <dxc:AxisX2D.WholeRange>
            <dxc:Range MinValue="05/24/2016"
                       MaxValue="08/25/2016"/>
        </dxc:AxisX2D.WholeRange>
        <dxc:AxisX2D.VisualRange>
            <dxc:Range MinValue="06/18/2016"
                       MaxValue="07/03/2016"/>
        </dxc:AxisX2D.VisualRange>
    </dxc:AxisX2D>
</dxc:XYDiagram2D.AxisX>
<!--...-->
You can call the Range.SetMinMaxValues method to limit a range at runtime. The following code customizes an x-axis’s visual range:
using DevExpress.Xpf.Charts;

private void Window_Loaded(object sender, RoutedEventArgs e) {
    Range visualRange = ((XYDiagram2D)chartControl1.Diagram).ActualAxisX.ActualVisualRange;
    visualRange.SetMinMaxValues(minValue: new DateTime(2019, 4, 1), maxValue: new DateTime(2019, 10, 1));
}
Call the Range.SetAuto() method to ignore the previously set limits and enable automatic range calculation.
Obtain Range Limits in Internal Units
The chart control converts values that are used to specify range limits for non-numeric (Qualitative, DateTime, and TimeSpan) axes to numeric equivalents. To obtain these values, use the Range.ActualMinValueInternal and Range.ActualMaxValueInternal properties.
Call the AxisBase.GetScaleValueFromInternal method to convert a limit value from internal numeric units to units of the axis.
How to Display a Specified Range of Points
The following example displays the first five series points when you use a qualitative axis and arguments are unknown:
<Window xmlns:dxc="http://schemas.devexpress.com/winfx/2008/xaml/charts" ...>
    <Grid>
        <dxc:ChartControl x:Name="chartControl"
                          BoundDataChanged="ChartControl_BoundDataChanged">
                          <!--...-->
        </dxc:ChartControl>
    </Grid>
</Window>
using DevExpress.Xpf.Charts;
using System;

namespace ChartSample {
    public partial class MainWindow : Window {
        private void ChartControl_BoundDataChanged(object sender, RoutedEventArgs e) {
            XYDiagram2D diagram = chartControl.Diagram as XYDiagram2D;
            if (diagram != null) {
                string min = diagram.ActualAxisX.GetScaleValueFromInternal(0).ToString();
                string max = diagram.ActualAxisX.GetScaleValueFromInternal(4).ToString();
                diagram.ActualAxisX.ActualVisualRange.SetMinMaxValues(min, max);
            }
        }
    }
}
How to Prevent Automatic X-Axis Range Calculation
The chart control does not plot qualitative point arguments on an x-axis if point values are out the specified y-axis whole range. This occurs because of automatic x-axis whole range calculation.
The following code specifies an x-axis whole range to display all argument values after a custom y-axis whole range is set:
private void chartControl_BoundDataChanged(object sender, RoutedEventArgs e)
{
    XYDiagram2D diagram = (XYDiagram2D)chartControl.Diagram;

    var currentXmin = diagram.ActualAxisX.GetScaleValueFromInternal(diagram.ActualAxisX.ActualWholeRange.ActualMinValueInternal);
    var currentXmax = diagram.ActualAxisX.GetScaleValueFromInternal(diagram.ActualAxisX.ActualWholeRange.ActualMaxValueInternal);

    if (diagram.ActualAxisY.WholeRange == null)
        diagram.ActualAxisY.WholeRange = new Range();

    diagram.ActualAxisY.WholeRange.MinValue = 5;
    diagram.ActualAxisY.WholeRange.MaxValue = 20;

    diagram.ActualAxisX.ActualWholeRange.SetMinMaxValues(currentXmin, currentXmax);
}
How to Specify Diagram Side Margins
The Chart Control adds additional margins between the outermost series point and the diagram’s edge. To configure margins, use the Range.StartSideMargin, Range.EndSideMargin or Range.SideMarginsValue property.
AutoSideMargins = true | SideMarginsValue = 0 (AutoSideMargins = false) |
|---|---|
|
|


The following example shows how to remove margins:
Markup:
<dxc:XYDiagram2D.AxisX>
    <dxc:AxisX2D x:Name="xAxis">
        <dxc:AxisX2D.WholeRange>
            <dxc:Range SideMarginsValue="0"/>
        </dxc:AxisX2D.WholeRange>
    </dxc:AxisX2D>
</dxc:XYDiagram2D.AxisX>
At runtime:
The SideMarginSizeUnit property defines margin measurement units. When SideMarginSizeUnit is set to SideMarginSizeUnit.AxisUnit (the default value), margins are specified in axis measurement units.
To define margins as a percentage of the axis range, set Range.SideMarginSizeUnit to SideMarginSizeUnit.AxisRangePercentage.
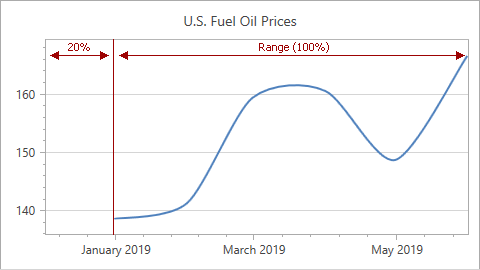
The example below demonstrates how to set the left margin as a percentage:
Markup:
<dxc:ChartControl ... >
    <dxc:XYDiagram2D>
        <dxc:XYDiagram2D.AxisX>
            <dxc:AxisX2D x:Name="xAxis" ...>
                <dxc:AxisX2D.WholeRange>
                    <dxc:Range StartSideMargin="20"
                               SideMarginSizeUnit="AxisRangePercentage"/>
                </dxc:AxisX2D.WholeRange>
            </dxc:AxisX2D>
        </dxc:XYDiagram2D.AxisX>
    </dxc:XYDiagram2D>
    ...
</dxc:ChartControl>
At runtime:
Range range = new Range();
xAxis.WholeRange = range;
range.SideMarginSizeUnit = SideMarginSizeUnit.AxisRangePercentage;
range.StartSideMargin = 20;
If you specify the SideMarginsValue, StartSideMargin or EndSideMargin property, the control ignores the Range.AutoSideMargins property.
How to Hide Zero Level on a Chart Value Axis
When a y-axis range is automatically calculated, you can use the AlwaysShowZeroLevel property to hide the zero value level. In this case, a new optimal minimum value is specified for the y-axis:
| AlwaysShowZeroLevel = true | AlwaysShowZeroLevel = false |
|---|---|
 |
 |
Use the code below to hide a y-axis’s zero level:
<dxc:XYDiagram2D>
    <dxc:XYDiagram2D.AxisY>
        <dxc:AxisY2D>
            <dxc:AxisY2D.WholeRange>
                <dxc:Range dxc:AxisY2D.AlwaysShowZeroLevel="False"/>
            </dxc:AxisY2D.WholeRange>
        </dxc:AxisY2D>
    </dxc:XYDiagram2D.AxisY>
    <!--...-->
</XYDiagram2D>
Use the following properties to hide the zero level in 3D charts, circular charts (Polar, and Radar series):
How to Configure Y-Axis’s Range Based on X-Axis’s Visual Range
The XYDiagram2D.DependentAxesYRange option allows you to only display y-axis values for point values that are in the x-axis’s visual range.
| DependentAxesYRange = false | DependentAxesYRange = true |
|---|---|
 |
 |
The following markup shows how to do this:
<dxc:ChartControl>
    <dxc:XYDiagram2D DependentAxesYRange="True">
        <dxc:XYDiagram2D.AxisX>
            <dxc:AxisX2D StickToEdge="True"/>
        </dxc:XYDiagram2D.AxisX>
        <!--...-->
    </dxc:XYDiagram2D>
</dxc:ChartControl>