XY-Diagram 3D
Short Description
The 3D XY-Diagram allows you to plot 3D XY series. This diagram allows you to represent and compare series point numeric and percentage values in different formats. This representation is useful when you need to show trends for several series on the same diagram, and show the relationship of the parts to the whole.
An example of the XY Diagram is shown below.
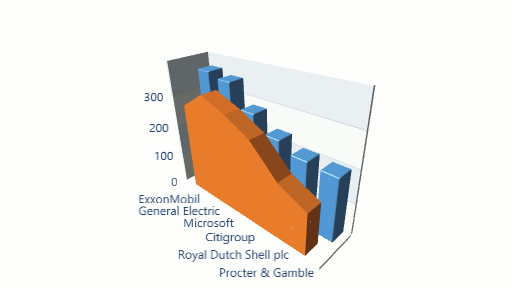
Diagram Characteristics
The table below lists the main properties of this diagram type.
| Feature | Value |
|---|---|
| Diagram class | XYDiagram3D |
| Axes accessibility | XYDiagram3D.AxisX, XYDiagram3D.AxisY |
| Properties to customize diagram appearance | XYDiagram3D.DomainBrush, XYDiagram3D.Material, XYDiagram3D.HeightToWidthRatio, XYDiagram3D.PlaneDepthFixed, XYDiagram3D.SeriesDistance, XYDiagram3D.SeriesPadding |
| Compatible series types | Area Series; Bar Series; Point and Bubble Series |
For information on which series view types can be combined with this diagram type, refer to Series Type Compatibility.