Conditional Formatting
- 8 minutes to read
The Pivot Grid control includes a Microsoft Excel-inspired conditional formatting feature, which allows you to change the appearance of individual cells based on specific conditions. This feature helps to highlight important information, identify trends and exceptions, and compare data.
Conditional Formatting Overview
Conditional formatting allows you to change the appearance of data cells based on specific conditions. Use the FormatConditionBase.MeasureName property to specify a data field whose values should be formatted. Then, use the field’s PivotGridField.Name property value to refer to the field.
Important
It is necessary to set the PivotGridField.Name property for all fields in order for the conditional formatting to work properly.
To apply a format condition, create a new instance of the required format type (the FormatConditionBase class descendant), specify its parameters and add it to the PivotGridControl.FormatConditions collection. The following formatting types are available by default.
| Condition Type | Condition Class | Description |
|---|---|---|
| Format using color scales | ColorScaleFormatCondition | Allows you to display data distribution and variation using a gradation of colors. |
| Format using data bars | DataBarFormatCondition | Applies a format using a data bar. The bar length changes proportionally to a cell value. A longer bar corresponds to a higher value, and a shorter bar corresponds to a lower value. |
| Format using icons | IconSetFormatCondition | An icon set format allows you to classify column values into several ranges separated by threshold values, and display a specific icon in a column cell according to the range to which this cell value belongs. |
| Format only top or bottom rank values, or values that are above or below average | TopBottomRuleFormatCondition | Applies a format if a value is in the range of the highest/lowest fields intersection data values or if a cell value(s) is above or below the fields intersection data average. |
| Format based on value(s) or user-defined expression(s) | FormatCondition | Applies a format if a column’s value meets a specified condition (Equal, Less, Between, etc.) or expression. |
You can apply the rule to all data cells, or a specified row and column intersection.
- To apply format conditions to a specified row and column intersection, set the condition’s FormatConditionBase.ApplyToSpecificLevel property to true and specify both the column and row using the FormatConditionBase.ColumnName and FormatConditionBase.RowName properties, respectively.
- To apply format condition to all data cells, make sure that the condition’s FormatConditionBase.ApplyToSpecificLevel is set to false. In this case, the FormatConditionBase.ColumnName and FormatConditionBase.RowName properties are ignored.
Note
Note that the TopBottomRuleFormatCondition rule is not an effect for all data cells. Specify the row and column intersection to make this rule work correctly.
Note
When printing the Pivot Grid control and exporting it to PDF, HTML, MHT, RTF and XLS(X) formats, conditional formatting using icons and data bars is not printed/exported.
Create Format Conditions at Design Time
You can edit format conditions at design time in three ways: using the design-time Conditional Formatting Rules Manager using the Format Condition Collection Editor, or manually creating format condition in XAML.
Design-time Conditional Formatting Rules Manager
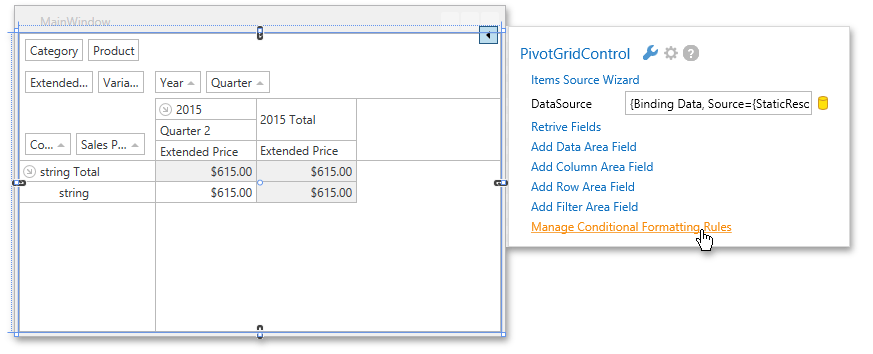
In the design view, right-click the Pivot Grid’s smart tag menu and select Manage Conditional Formatting Rules to invoke the conditional formatting manager.
Format Condition Collection Editor
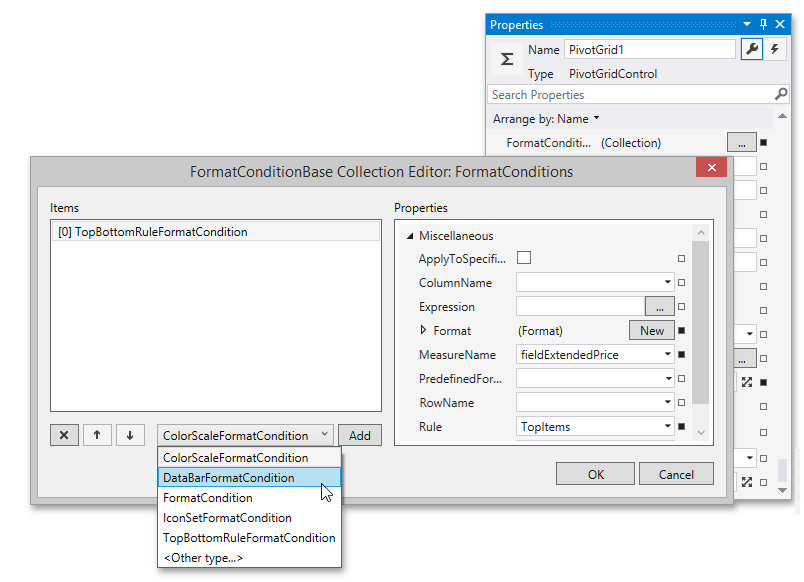
Click the ellipsis button for the PivotGridControl.FormatConditions to invoke the Collection Editor.
Create format conditions in XAML A new instance of the PivotGridControl is created with an empty collection of style format conditions. Use the PivotGridControl.FormatConditions property to access the collection of FormatConditionCollection objects containing style format conditions. You can manage this collection of rules both at design time and runtime.
Below you can see the data bar format condition, applied to the intersection of the ‘Sales Person’ and ‘Quarter’ fields. The ‘Variation’ field is set as measure. Positive values fill in with green-white gradient color, and negative values fill in with red-white gradient color.
<dxpg:PivotGridControl.FormatConditions>
    <dxpg:DataBarFormatCondition ApplyToSpecificLevel="True" ColumnName="fieldQuarter"
                   MeasureName="fieldVariation" RowName="fieldSalesPerson">
        <dx:DataBarFormat BorderBrush="#FF63C384" BorderBrushNegative="#FFFF555A">
            <dx:DataBarFormat.FillNegative>
                <LinearGradientBrush EndPoint="1,0">
                    <GradientStop Color="White" Offset="0"/>
                    <GradientStop Color="#FFFF555A" Offset="1"/>
                </LinearGradientBrush>
            </dx:DataBarFormat.FillNegative>
            <dx:DataBarFormat.Fill>
                <LinearGradientBrush EndPoint="1,0">
                    <GradientStop Color="#FF63C384" Offset="0"/>
                    <GradientStop Color="White" Offset="1"/>
                </LinearGradientBrush>
            </dx:DataBarFormat.Fill>
        </dx:DataBarFormat>
    </dxpg:DataBarFormatCondition>
</dxpg:PivotGridControl.FormatConditions>
Create Format Conditions at Runtime
To create a format condition at runtime, right-click the data cell, to which fields intersection you want to add a format condition, and select Conditional Formatting to invoke the conditional formatting menu. This menu is available when the PivotGridControl.AllowConditionalFormattingMenu property is set to true.
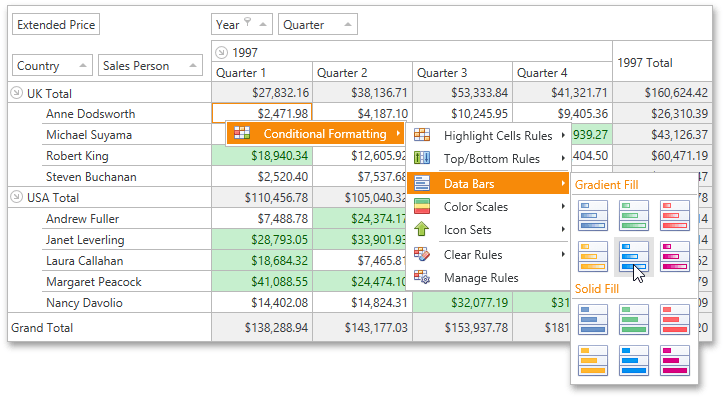
Select the required condition, specify its parameters, measure name and intersection of row and column fields, and then click OK. Besides, you can manage format conditions at runtime using the Conditional Formatting Rules Manager.
Conditional Formatting Rules Manager
You can create, sort and modify the created rules at runtime and design time using the Conditional Formatting Rules Manager. This Manager is available both at design time and runtime. To invoke it at runtime, select the Manage Rules item from the Conditional Formatting context menu. In the design view, right-click the Pivot Grid’s smart tag menu and select Manage Conditional Formatting Rules to invoke the conditional formatting manager.
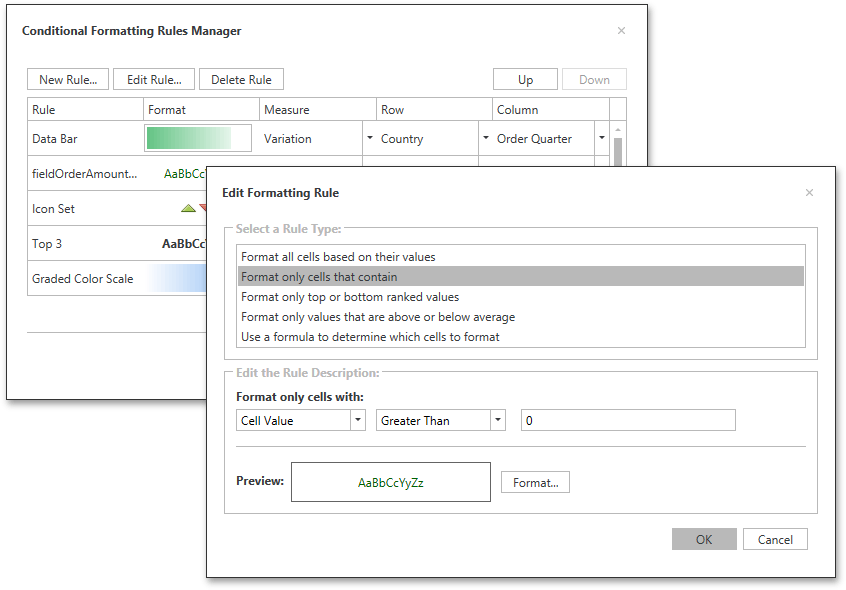
- To create a new rule, click the New Rule… button, select a rule type and specify its parameters. Depending on rule type, you can set maximum and minimum values, specify format, colors or icon style, etc.
- To edit the existent rule, click the Edit Rule… button and change the rule parameters. Besides that, you can see the rule’s format preview and specify the row, measure and column in the list of rules in the main window. Note that you can apply a rule to all data cells, or a specified row and column intersection. Select fields in the Row and Column drop-down lists to apply a format condition to the specified intersection. To apply a format condition to all data cells instead of intersection, set the Column and Row values to (Any).
- To delete the rule, select the rule and click the Delete Rule button.
- To reorder rules, select the rule and click Up or Down button.
Note
Set the control’s PivotGridControl.AllowConditionalFormattingManager property to true to make the Conditional Formatting Manager available for end users.
Example
This example shows how to add format conditions to WPF Pivot Grid Control.
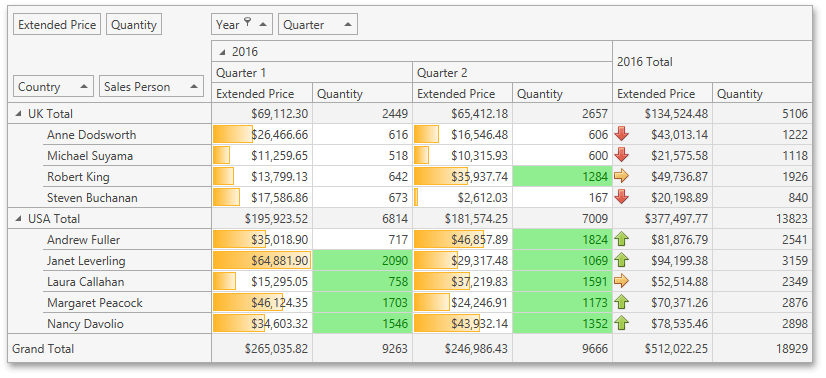
- The Data Bar conditional formatting is applied to the ‘Extended Price’ measure and intersection of the ‘Sales Person’ and ‘Quarter’ fields. This condition formats data cells with a predefined orange gradient data bar.
- The Top Bottom Rule conditional formatting is applied to the ‘Quantity’ measure and intersection of the ‘Sales Person’ and ‘Quarter’ fields. This condition formats data cells whose values are above average with green text and light green fill.
- The Icon Set conditional formatting is applied to the ‘Extended Price’ measure and intersection of the ‘Sales Person’ and ‘Year’ fields. This condition displays a specific icon in a cell according to the range to which this cell value belongs.
The image below shows the result.
using System.Windows;
using System;
using DevExpress.Xpf.PivotGrid;

namespace WpfPivotGridConditionalFormatting
{
    /// <summary>
    /// Interaction logic for MainWindow.xaml
    /// </summary>
    public partial class MainWindow : Window
    {
        public MainWindow()
        {
            InitializeComponent();

            FilterFieldValues(fieldYear, new int[]{2016}, FieldFilterType.Included);

            // Creates a new DataBarFormatCondition instance.
            DataBarFormatCondition formatRulesDataBar = new DataBarFormatCondition();

            // Adds this instance to the FormatConditionCollection.
            pivotGridControl1.AddFormatCondition(formatRulesDataBar);

            // Specifies a column field.
            formatRulesDataBar.ColumnName = "fieldQuarter";

            // Specifies a row field.
            formatRulesDataBar.RowName = "fieldSalesPerson";

            // Specifies a data field.
            formatRulesDataBar.MeasureName = "fieldExtendedPrice";

            // Applies the condition to intersection of row and column fields.
            formatRulesDataBar.ApplyToSpecificLevel = true;

            // Sets the predefined format.
            formatRulesDataBar.PredefinedFormatName = "OrangeGradientDataBar";


        }

        private void FilterFieldValues(PivotGridField field, int[] filterValues,
            FieldFilterType filterType)
        {
            pivotGridControl1.BeginUpdate();
            try
            {
                field.FilterValues.Clear();
                foreach (object filterValue in filterValues)
                    field.FilterValues.Add(filterValue);
            }
            finally
            {
                field.FilterValues.FilterType = filterType;
                pivotGridControl1.EndUpdate();
            }
        }
    }
}