Colorizers
- 3 minutes to read
This document describes the Chart Colorizer, lists colorizer types, and explains how to create a colorizer and customize its settings in a chart control.
The document consists of the following sections:
Overview
The Colorizer is used to choose colors for chart series points automatically, and stores it using the SeriesPoint.Brush property. This feature can be applied to the SeriesPoint class.
This can be useful, for example, for providing additional information using color.
Important
When the Chart Control aggregates series data, the aggregated point has the color that mostly occurs on the aggregated interval.
Perform the following steps before using this feature:
Specify the Series.DataSource property, if necessary, and all data member properties required to build a chart.
The colorizer allows you to provide colors for the series points the data source provides using one of the approaches that is discussed later.
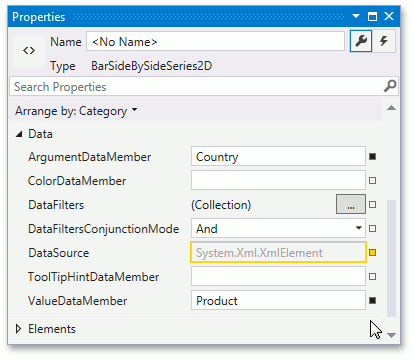
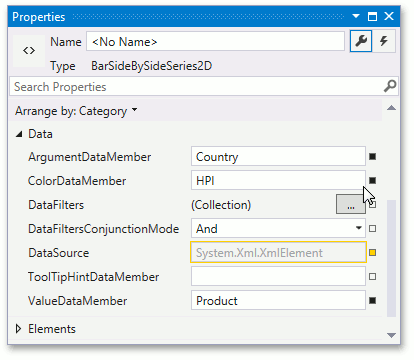
Specify the name of a data member that determines the color of the series’ Series.ColorDataMember property.
Determine which type of a colorizer an application should use:
- ColorObjectColorizer allows you to provide color data member values to the SeriesPoint.Brush property if these values have the Color type or a type that can be converted to a color (integer number or string).
- KeyColorColorizer allows you to choose the color depending on color data member values used as key values.
- RangeColorizer allows you to colorize points depending on the color data member values’ range.
After you select a colorizer type, assign the selected colorizer type’s object to the Series.Colorizer property, and customize the colorizer’s settings. The sections below describe how to do this.
Color Object Colorizer
This colorizer does not require specifying properties before using it. The following image demonstrates data colorized using a national color stored in the data source:
Note
This is the default colorizer.
Key-Color Colorizer
Perform the following steps to configure the key-color colorizer:
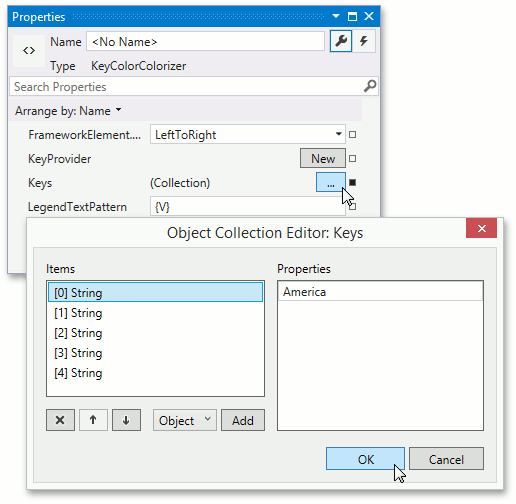
Fill the KeyColorColorizer.Keys collection.
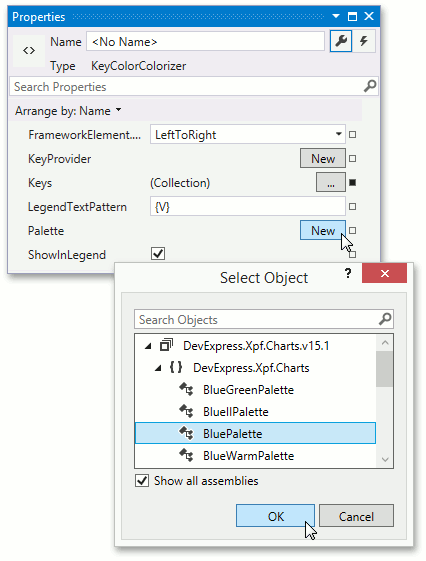
Specify the ChartPaletteColorizerBase.Palette property if you want to use a non-default palette to colorize your data.
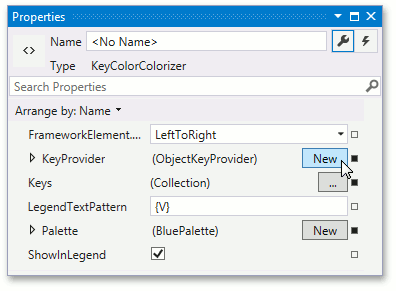
It is also possible to configure the KeyColorColorizer.KeyProvider property that allows specifying how a color key is generated from a color data source member.
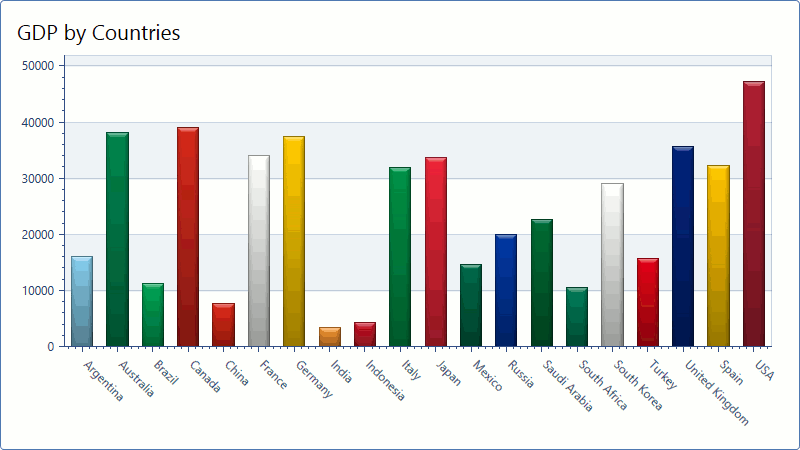
The following image demonstrates a bar chart colorized according to the country’s region using the key-color colorizer:
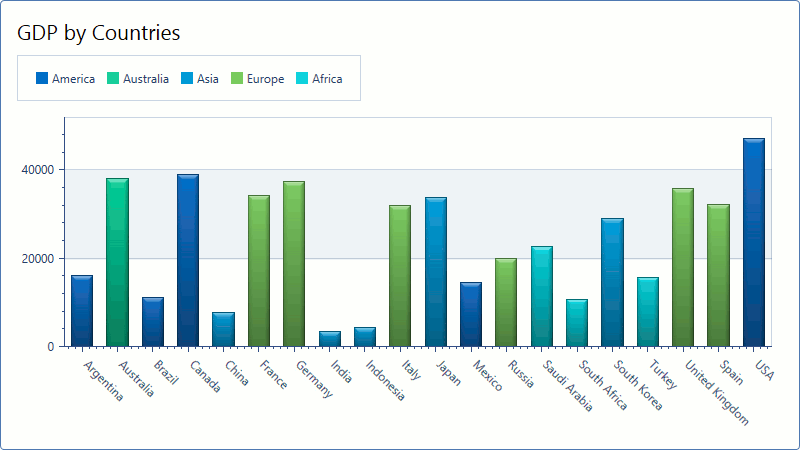
Range Colorizer
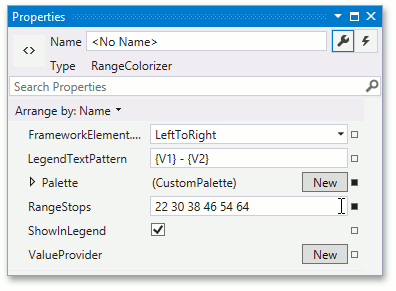
Follow the steps below to configure the range colorizer.
Fill the RangeColorizer.RangeStops collection. These values form ranges that are used to determine which color a series point should have.
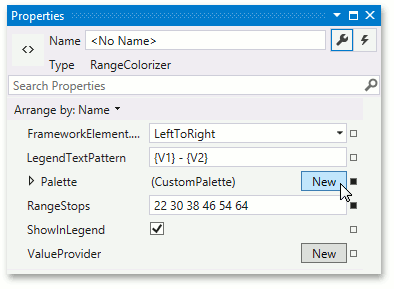
Specify the ChartPaletteColorizerBase.Palette property if you want to use a non-default palette to colorize your data.
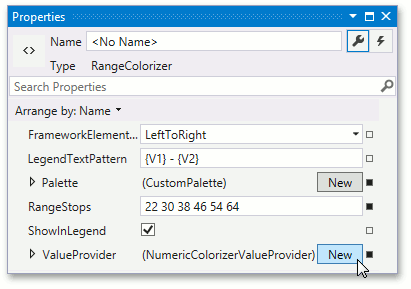
It is also possible to specify the RangeColorizer.ValueProvider property. This allows you to configure how to provide double-precision numeric values based on the color data series member values.
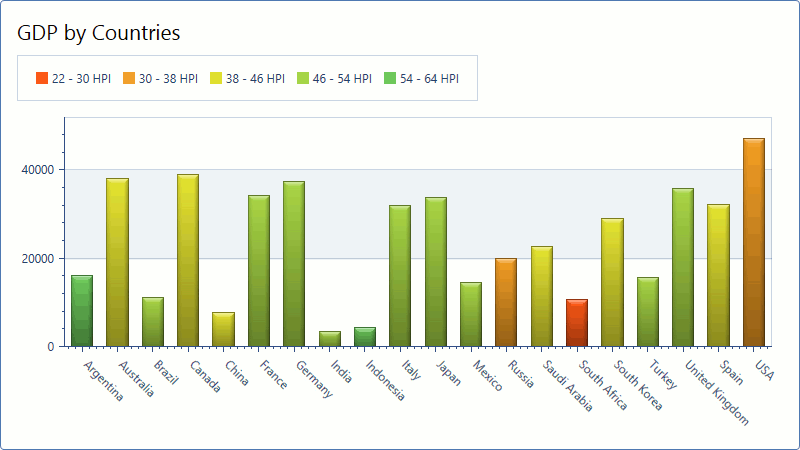
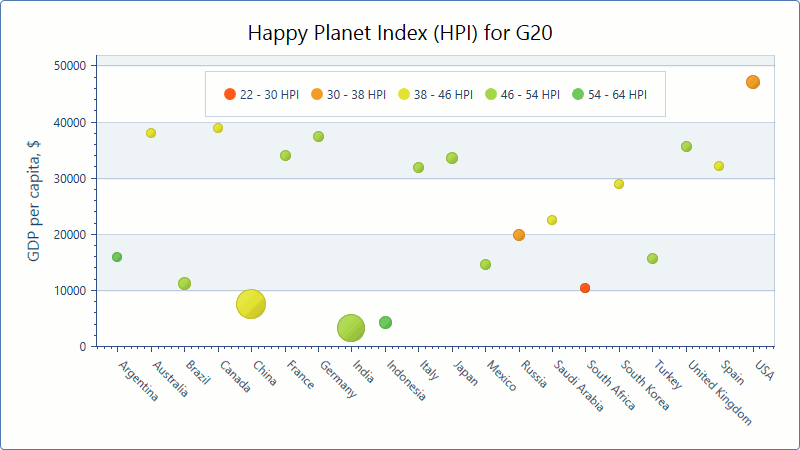
The following image demonstrates a bar chart colorized by the Happy Planet Index using the range colorizer: