Series Point Colorizers
- 5 minutes to read
The chart control uses colorizers to paint series points. This topic lists available colorizer types and explains how to apply them to a chart.
Follow the steps below to apply a colorizer to series points:
Bind the series to a data source. For more information, refer to the following help topic: Bind a Series to a Data Source.
Create one of the following colorizers:
Configure the colorizer’s settings and assign it to the Series.Colorizer property.
Specify the series’s ColorDataMember property to set a data source field that is used to determine point colors.
The color that a colorizer calculates for a series point is assigned to the SeriesPoint.Brush property. You can handle the ChartControl.BoundDataChanged event to access the chart diagram’s series collection and the resulting colors of individual series points.
If the chart control aggregates series data, the aggregated point has the color that mostly occurs on the aggregated interval.
For line and area series, a colorizer calculates colors only for point markers. If you want to paint the line or the area itself, use segment colorizers.
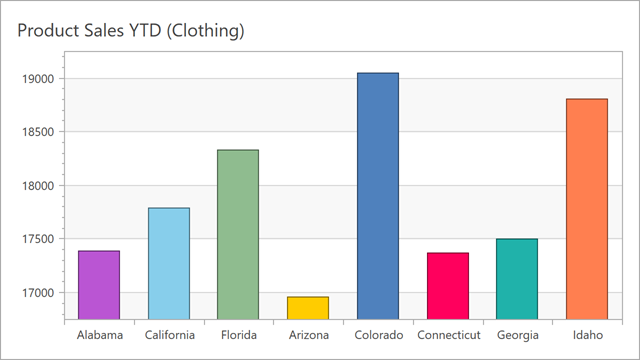
Color Object Colorizer
The ColorObjectColorizer applies a color to a series point that is stored in the defined data field associated with the point. Use the ColorDataMember property to specify the data field name. This data field can store colors in different formats:
- An integer ARGB color value (431493885)
- Three, four, six, or eight digit hex code (#fc0, #f00f, #ff005d, #ff32cd32)
- A string color name (SkyBlue)
- A Color object
- A SolidColorBrush object
The following example shows how to apply colors from a data source to series points:
<Window
    xmlns="http://schemas.microsoft.com/winfx/2006/xaml/presentation"
    xmlns:x="http://schemas.microsoft.com/winfx/2006/xaml"
    xmlns:d="http://schemas.microsoft.com/expression/blend/2008"
    xmlns:mc="http://schemas.openxmlformats.org/markup-compatibility/2006"
    xmlns:local="clr-namespace:ChartSample"
    xmlns:dxc="http://schemas.devexpress.com/winfx/2008/xaml/charts"
    xmlns:dx="http://schemas.devexpress.com/winfx/2008/xaml/core"
    x:Class="ChartSample.MainWindow"
    mc:Ignorable="d" Title="MainWindow" Height="640" Width="1350">
    <Window.DataContext>
        <local:MainWindowViewModel/>
    </Window.DataContext>
    <Grid>
        <dxc:ChartControl DataSource="{Binding Data}">
            <!-- ... -->
            <dxc:XYDiagram2D>
                <dxc:BarSideBySideSeries2D ArgumentDataMember="Argument"
                                           ValueDataMember="Value"
                                           ColorDataMember="Color">
                    <dxc:BarSideBySideSeries2D.Colorizer>
                        <dxc:ColorObjectColorizer/>
                    </dxc:BarSideBySideSeries2D.Colorizer>
                </dxc:BarSideBySideSeries2D>
                <!-- ... -->
            </dxc:XYDiagram2D>
        </dxc:ChartControl>
    </Grid>
</Window>
using System.Collections.ObjectModel;
using System.Windows;
using System.Windows.Media;

namespace ChartSample {
    public partial class MainWindow : Window {
        public MainWindow() {
            InitializeComponent();
        }
    }
    public class MainWindowViewModel {
        public ObservableCollection<DataPoint> Data { get; private set; }
        public MainWindowViewModel() {
            this.Data = DataPoint.GetDataPoints();
        }
    }
    public class DataPoint {
        public string Argument { get; set; }
        public double Value { get; set; }
        public object Color { get; set; }
        public static ObservableCollection<DataPoint> GetDataPoints() {
            return new ObservableCollection<DataPoint> {
                    new DataPoint { Argument = "Alabama",     Value = 17383, Color = Colors.MediumOrchid },
                    new DataPoint { Argument = "California",  Value = 17779, Color = "SkyBlue" },
                    new DataPoint { Argument = "Florida",     Value = 18327, Color = Brushes.DarkSeaGreen },
                    new DataPoint { Argument = "Arizona",     Value = 16957, Color = "#fc0" },
                    new DataPoint { Argument = "Colorado",    Value = 19039, Color = "#ffof" },
                    new DataPoint { Argument = "Connecticut", Value = 17360, Color = "#ff005d" },
                    new DataPoint { Argument = "Georgia",     Value = 17491, Color = "#ff20b2aa" },
                    new DataPoint { Argument = "Idaho",       Value = 18801, Color = -32944 }
                   };
        }
    }
}
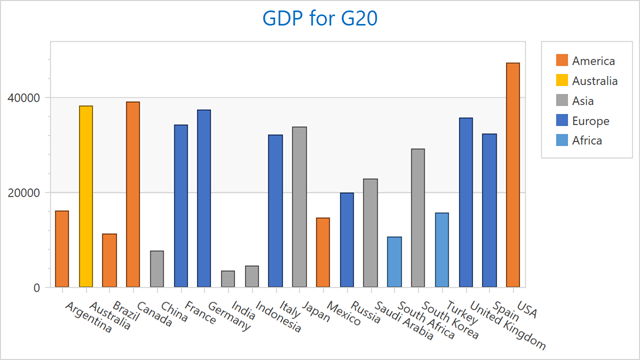
Key-Color Colorizer
The KeyColorColorizer applies colors to series points based on key values (keys) associated with the points. Points with equal keys have the same color. Populate the Keys collection with key values to specify the order in which the palette colors are assigned to keys. You should use values from a data source field that specifies ColorDataMember. If the Keys collection is empty, colors are applied to series points in the order keys have in the data source.
The following example shows how to paint series points by key values:
<dxc:BarSideBySideSeries2D DisplayName="GDP"
                           DataSource="{Binding XPath=/G20HPIs/CountryStatistics}"
                           ArgumentDataMember="Country" ValueDataMember="Product"
                           ColorDataMember="Region">
    <dxc:BarSideBySideSeries2D.Colorizer>
        <dxc:KeyColorColorizer>
            <dxc:KeyColorColorizer.Keys>
                <sys:String>Africa</sys:String>
                <sys:String>America</sys:String>
                <sys:String>Asia</sys:String>
                <sys:String>Australia</sys:String>
                <sys:String>Europe</sys:String>
            </dxc:KeyColorColorizer.Keys>
            <dxc:KeyColorColorizer.Palette>
                <dxc:Office2013Palette/>
            </dxc:KeyColorColorizer.Palette>
        </dxc:KeyColorColorizer>
    </dxc:BarSideBySideSeries2D.Colorizer>
</dxc:BarSideBySideSeries2D>
You can also specify the KeyColorColorizer.KeyProvider property to calculate keys based on custom logic.
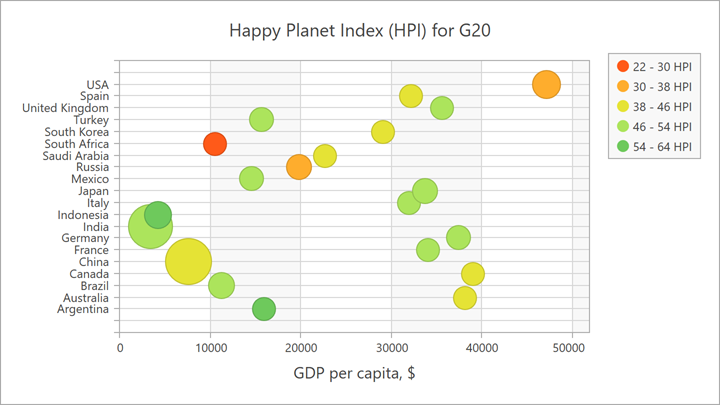
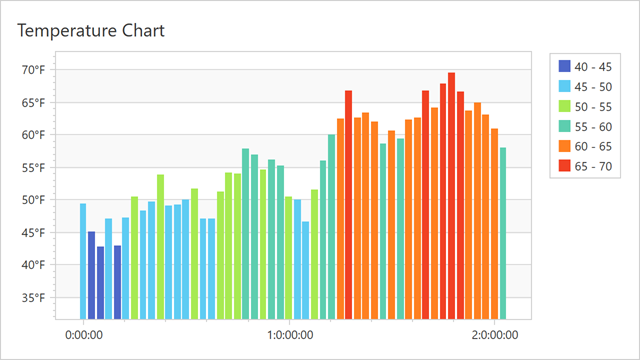
Range Colorizer
The RangeColorizer applies colors based on ranges to which series point values belong. Use the RangeColorizer.RangeStops property to specify color boundaries.
<dxc:BarSideBySideSeries2D DataSource="{Binding Data}"
                           ArgumentDataMember="TimeStamp"
                           ValueDataMember="Temperature"
                           ArgumentScaleType="TimeSpan"
                           ColorDataMember="Temperature">
    <dxc:BarSideBySideSeries2D.Colorizer>
        <dxc:RangeColorizer RangeStops="40 45 50 55 60 65 70"
                            LegendTextPattern="{}{V1} - {V2}">
            <dxc:RangeColorizer.Palette>
                <dxc:SlipstreamPalette/>
            </dxc:RangeColorizer.Palette>
        </dxc:RangeColorizer>
    </dxc:BarSideBySideSeries2D.Colorizer>
</dxc:BarSideBySideSeries2D>
If you want to distribute colors based on custom values, specify the RangeColorizer.ValueProvider property.