Scatter Radar Line
Short Description
The Scatter Radar Line series is useful when it’s necessary to display series points on a circular grid in the same order they were added to the collection, without grouping by the argument. This feature is the main difference between this and other series types, which sort and group points by arguments.
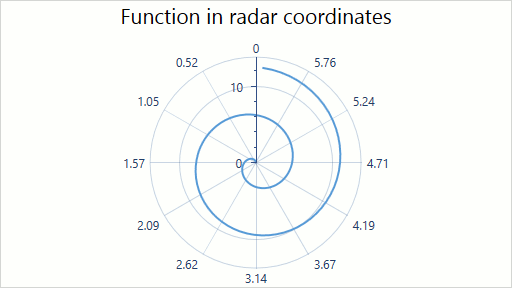
For example, the following image demonstrates a Scatter Radar Line chart, representing a graph for the Archimedean Spiral function.
Series Characteristics
The table below lists the main characteristics of this chart type.
| Feature | Value |
|---|---|
| Series View type | RadarLineScatterSeries2D |
| Diagram type | RadarDiagram2D |
| Number of arguments per series point | 1 |
| Number of values per series point | 1 |
Note
- For information on which series view types can be combined with the Scatter Radar Line view, refer to the Series Type Compatibility document.
- This series view type is displayed correctly only if scale types of the X and Y axes are numeric continuous. For more information, refer to the ContinuousNumericScaleOptions document.
Example
The following example demonstrates how to create a 2D Scatter Radar Line chart.