How to: Create a 2D Range Area Chart
- 3 minutes to read
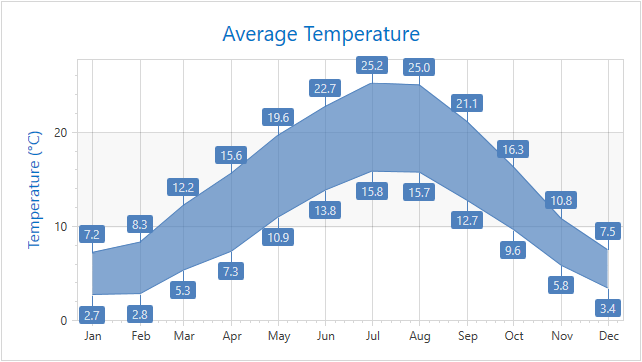
The following example demonstrates how to create a Range Area chart:
Assign the ChartControl.Diagram property to XYDiagram2D.
Add a RangeAreaSeries2D object to the diagram’s Diagram.Series collection.
Specify the following series properties:
<Window x:Class="RangeArea2DChart.MainWindow"
xmlns="http://schemas.microsoft.com/winfx/2006/xaml/presentation"
xmlns:x="http://schemas.microsoft.com/winfx/2006/xaml"
xmlns:dxc="http://schemas.devexpress.com/winfx/2008/xaml/charts"
xmlns:local ="clr-namespace:RangeArea2DChart"
Title="MainWindow" Height="350" Width="640">
<Grid>
<dxc:ChartControl Name="chartControl1">
<dxc:ChartControl.DataContext>
<local:ChartViewModel/>
</dxc:ChartControl.DataContext>
<dxc:ChartControl.Diagram>
<dxc:XYDiagram2D>
<dxc:XYDiagram2D.Series>
<dxc:RangeAreaSeries2D DisplayName="Day-Night"
DataSource="{Binding DataPoints}"
ArgumentScaleType="DateTime"
ArgumentDataMember="Time"
ValueDataMember="Value1"
dxc:RangeAreaSeries2D.Value2DataMember="Value2"
Transparency="0.3"
Marker1Visible="False" Marker2Visible="False"
LabelsVisibility="True"
CrosshairLabelPattern="{}{A:MMMM} D: {V1:f2} N: {V2:f2}">
<dxc:RangeAreaSeries2D.Label>
<dxc:SeriesLabel TextPattern="{}{V:f1}"/>
</dxc:RangeAreaSeries2D.Label>
</dxc:RangeAreaSeries2D>
</dxc:XYDiagram2D.Series>
<dxc:XYDiagram2D.AxisX>
<dxc:AxisX2D GridLinesVisible="True">
<dxc:AxisX2D.WholeRange>
<dxc:Range SideMarginsValue="10"/>
</dxc:AxisX2D.WholeRange>
<dxc:AxisX2D.Label>
<dxc:AxisLabel TextPattern="{}{A:MMM}"/>
</dxc:AxisX2D.Label>
<dxc:AxisX2D.DateTimeScaleOptions>
<dxc:ManualDateTimeScaleOptions GridSpacing="1"
GridAlignment="Month"
AutoGrid="False"/>
</dxc:AxisX2D.DateTimeScaleOptions>
</dxc:AxisX2D>
</dxc:XYDiagram2D.AxisX>
<dxc:XYDiagram2D.AxisY>
<dxc:AxisY2D>
<dxc:AxisY2D.Title>
<dxc:AxisTitle Content="Temperature (°C)"/>
</dxc:AxisY2D.Title>
</dxc:AxisY2D>
</dxc:XYDiagram2D.AxisY>
</dxc:XYDiagram2D>
</dxc:ChartControl.Diagram>
<dxc:ChartControl.Titles>
<dxc:Title Dock="Top" HorizontalAlignment="Center">Average Temperature</dxc:Title>
</dxc:ChartControl.Titles>
</dxc:ChartControl>
</Grid>
</Window>
using System;
using System.Collections.Generic;
using System.Windows;
namespace RangeArea2DChart {
    //..
    public class ChartViewModel {
        List<DataPoint> dataPoints;
        public List<DataPoint> DataPoints {
            get {
                if (dataPoints == null) {
                    dataPoints = new List<DataPoint> {
                            new DataPoint (new DateTime(2019, 1, 1), 7.2, 2.7),
                            new DataPoint (new DateTime(2019, 2, 1), 8.3, 2.8),
                            new DataPoint (new DateTime(2019, 3, 1), 12.2, 5.3),
                            new DataPoint (new DateTime(2019, 4, 1), 15.6, 7.3),
                            new DataPoint (new DateTime(2019, 5, 1), 19.6, 10.9),
                            new DataPoint (new DateTime(2019, 6, 1), 22.7, 13.8),
                            new DataPoint (new DateTime(2019, 7, 1), 25.2, 15.8),
                            new DataPoint (new DateTime(2019, 8, 1), 25, 15.7),
                            new DataPoint (new DateTime(2019, 9, 1), 21.1, 12.7),
                            new DataPoint (new DateTime(2019, 10, 1), 16.3, 9.6),
                            new DataPoint (new DateTime(2019, 11, 1), 10.8, 5.8),
                            new DataPoint (new DateTime(2019, 12, 1), 7.5, 3.4)
                };
                }
                return dataPoints;
            }
        }
    }
    public class DataPoint {
        public DateTime Time { get; set; }
        public double Value1 { get; set; }
        public double Value2 { get; set; }
        public DataPoint(DateTime time, double value1, double value2) {
            this.Time = time;
            this.Value1 = value1;
            this.Value2 = value2;
        }
    }
}