Range Area
Short Description
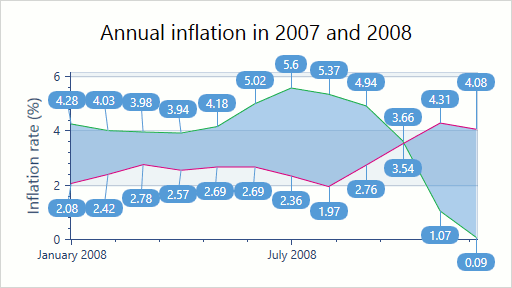
The Range Area series displays series as filled areas on a diagram, with two data points that define minimum and maximum limits. This chart is useful when you need to accentuate the delta between start and end values.
An example of the Range Area chart is shown in the image below.
Series Characteristics
The table below lists the main characteristics of this chart type.
| Feature | Value |
|---|---|
| Series View type | RangeAreaSeries2D |
| Diagram type | XYDiagram2D |
| Number of arguments per series point | 1 |
| Number of values per series point | 2 |
For information on which series view types can be combined with the Range Area view, refer to the Series Types Compatibility document.
Example
The following example demonstrates how to create a 2D Range Area chart.