Panes
- 8 minutes to read
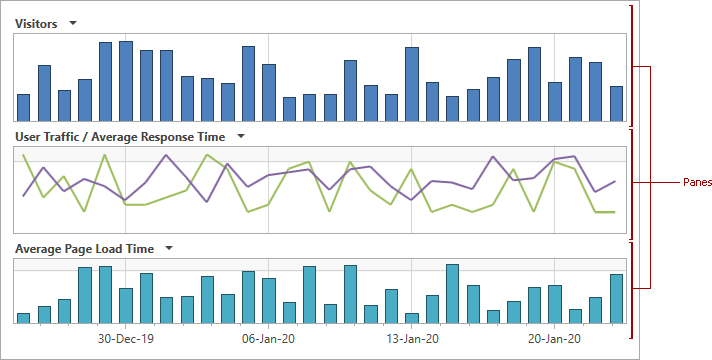
A pane is an area within a 2D XY Diagram that displays series, axes, and other elements.
Demo: Panes
This document consists of the following sections:
Add Panes
After creation, an XY diagram contains one default pane. Use the XYDiagram2D.DefaultPane property to access this pane’s options:
<dxc:ChartControl>
    <dxc:XYDiagram2D x:Name="diagram">
        <dxc:XYDiagram2D.DefaultPane>
            <dxc:Pane x:Name="defaultPane" Background="Cornsilk"/>
        </dxc:XYDiagram2D.DefaultPane>
    </dxc:XYDiagram2D>
</dxc:ChartControl>
To add multiple panes to a diagram, create the Pane class objects and add them to the XYDiagram2D.Panes collection. To assign a particular pane to a series, use the XYSeries2D.Pane property (if you use v17.1 and earlier, see the How to Assign a Pane to a Series in v17.1 and Earlier Versions section). A series is displayed in the default pane if no pane is assigned.
The following code creates a chart with three panes:
<dxc:ChartControl x:Name="chart">
    <dxc:XYDiagram2D x:Name="diagram">

        <dxc:XYDiagram2D.DefaultPane>
            <dxc:Pane x:Name="defaultPane"/>
        </dxc:XYDiagram2D.DefaultPane>

        <dxc:XYDiagram2D.Panes>
            <dxc:Pane x:Name="pane1"/>
            <dxc:Pane x:Name="pane2"/>
        </dxc:XYDiagram2D.Panes>

        <dxc:LineSeries2D Pane="{Binding ElementName=defaultPane}" .../>
        <dxc:LineSeries2D Pane="{Binding ElementName=pane1}" .../>
        <dxc:LineSeries2D Pane="{Binding ElementName=pane2}" .../>

    </dxc:XYDiagram2D>
</dxc:ChartControl>
To bind a series to a particular pane at runtime, use the following code:
XYDiagram2D diagram = chartControl.Diagram as XYDiagram2D;
XYSeries2D series1 = diagram.Series[1] as XYSeries2D;
Pane pane1 = new Pane();
diagram.Panes.Add(pane1);
series1.Pane = pane1;
To hide a pane with its contents, configure the Pane.Visibility property.
If panes have titles, you can allow users to collapse panes at runtime. To do this, enable the Pane.RuntimeCollapse property (or use XYDiagram2D.RuntimePaneCollapse at the digram level).
Note
Multiple panes use the same axes unless you add secondary axes and bind them to a corresponding series.
How to Assign a Pane to a Series in v17.1 and Earlier Versions
Use the attached XYDiagram2D.SeriesPane property to link a series to a pane:
<dxc:LineSeries2D dxc:XYDiagram2D.SeriesPane="{Binding ElementName=pane1}".../>
The following code allows you to bind a series to a pane at runtime:
XYDiagram2D diagram = chartControl.Diagram as XYDiagram2D;
XYSeries2D series1 = diagram.Series[1] as XYSeries2D;
Pane pane1 = new Pane();
diagram.Panes.Add(pane1);
XYDiagram2D.SetSeriesPane(series1, pane1);
Generate Panes from a View Model (MVVM Approach)
If your application is built based on the MMVM pattern, use the following properties to generate panes from a View Model:
XYDiagram2D.PaneItemsSource - Gets or sets the collection of objects used to generate panes.
XYDiagram2D.PaneItemTemplate - Gets or sets the DataTemplate that specifies how to convert a model object to a pane.
Markup:
<Window
        xmlns="http://schemas.microsoft.com/winfx/2006/xaml/presentation"
        xmlns:x="http://schemas.microsoft.com/winfx/2006/xaml"
        xmlns:d="http://schemas.microsoft.com/expression/blend/2008"
        xmlns:mc="http://schemas.openxmlformats.org/markup-compatibility/2006"
        xmlns:local="clr-namespace:PanesMvvmSample"
        xmlns:dxc="http://schemas.devexpress.com/winfx/2008/xaml/charts"
        x:Class="PanesMvvmSample.MainWindow"
        mc:Ignorable="d"
        Title="MainWindow" Height="450" Width="800">
    <Window.DataContext>
        <local:ChartViewModel/>
    </Window.DataContext>
    <Grid>
        <dxc:ChartControl>
            <dxc:XYDiagram2D SeriesItemsSource="{Binding SaleSeries}" PaneItemsSource="{Binding SalePanes}">
                <dxc:XYDiagram2D.SeriesItemTemplate>
                    <DataTemplate>
                        <dxc:LineSeries2D DisplayName="{Binding Category}"
                                          DataSource="{Binding Values}"
                                          Pane="{Binding Pane}"
                                          ArgumentDataMember="Year"
                                          ValueDataMember="Value" MarkerVisible="True"/>
                    </DataTemplate>
                </dxc:XYDiagram2D.SeriesItemTemplate>
                <dxc:XYDiagram2D.DefaultPane>
                    <dxc:Pane Visibility="Collapsed"/>
                </dxc:XYDiagram2D.DefaultPane>
                <dxc:XYDiagram2D.PaneItemTemplate>
                    <DataTemplate>
                        <dxc:Pane dxc:GridLayout.RowSpan="{Binding Weight}">
                            <dxc:Pane.Title>
                                <dxc:PaneTitle Content="{Binding Title}" FontSize="12" FontWeight="Bold" Visible="True"/>
                            </dxc:Pane.Title>
                        </dxc:Pane>
                    </DataTemplate>
                </dxc:XYDiagram2D.PaneItemTemplate>
                <dxc:XYDiagram2D.PaneLayout>
                    <dxc:GridLayout>
                        <dxc:GridLayout.ColumnDefinitions>
                            <dxc:LayoutDefinition/>
                        </dxc:GridLayout.ColumnDefinitions>
                    </dxc:GridLayout>
                </dxc:XYDiagram2D.PaneLayout>
                <dxc:XYDiagram2D.AxisX>
                    <dxc:AxisX2D VisibilityInPaneItemsSource="{Binding SalePanes}" Visible="True">
                        <dxc:AxisX2D.VisibilityInPaneItemTemplate>
                            <DataTemplate>
                                <ContentControl>
                                    <dxc:VisibilityInPane Pane="{Binding}" Visible="{Binding ShowXAxis}"/>
                                </ContentControl>
                            </DataTemplate>
                        </dxc:AxisX2D.VisibilityInPaneItemTemplate>
                    </dxc:AxisX2D>
                </dxc:XYDiagram2D.AxisX>
                ...
            </dxc:XYDiagram2D>
            ...
        </dxc:ChartControl>
    </Grid>
</Window>
Chart View Model:
using System;
using System.Collections.Generic;
using System.Collections.ObjectModel;
using System.Windows;
namespace PanesMvvmSample {
    public partial class MainWindow : Window {
        public MainWindow() {
            InitializeComponent();
        }
    }
    public class ChartViewModel {
        public IEnumerable<SaleSeries> SaleSeries { get; private set; }
        public IEnumerable<SalePane> SalePanes { get; private set; }
        public ChartViewModel() {
            SalePane pane1 = new SalePane { ShowXAxis = false, Weight = 4, Title = "Smartphones (Millions of USD)" };
            SalePane pane2 = new SalePane { ShowXAxis = true, Weight = 3, Title = "Laptops (Millions of USD)" };
            SaleSeries = new Collection<SaleSeries> {
                new SaleSeries {
                    Category = "Smartphones",
                    Values = new Collection<SaleInfo> {
                        new SaleInfo { Year = 2015, Value = 11.065},
                        new SaleInfo { Year = 2014, Value = 10.482},
                        new SaleInfo { Year = 2013, Value = 9.607},
                        new SaleInfo { Year = 2012, Value = 8.561},
                        new SaleInfo { Year = 2011, Value = 7.573},
                        new SaleInfo { Year = 2010, Value = 6.101},
                        new SaleInfo { Year = 2009, Value = 5.11},
                        new SaleInfo { Year = 2008, Value = 4.598}
                    },
                    Pane = pane1
                },
                new SaleSeries {
                    Category = "Laptops",
                    Values = new Collection<SaleInfo> {
                        new SaleInfo { Year = 2015, Value = 4.383},
                        new SaleInfo { Year = 2014, Value = 4.849},
                        new SaleInfo { Year = 2013, Value = 5.156},
                        new SaleInfo { Year = 2012, Value = 6.203},
                        new SaleInfo { Year = 2011, Value = 6.157},
                        new SaleInfo { Year = 2010, Value = 5.7},
                        new SaleInfo { Year = 2009, Value = 5.231},
                        new SaleInfo { Year = 2008, Value = 5.038}
                    },
                    Pane = pane2
                }
            };
            SalePanes = new Collection<SalePane> { pane1, pane2 };
        }
    }
    public class SalePane {
        public bool ShowXAxis { get; set; }
        public string Title { get; set; }
        public byte Weight { get; set; }
    }
    public class SaleSeries {
        public string Category { get; set; }
        public IEnumerable<SaleInfo> Values { get; set; }
        public SalePane Pane { get; set; }
    }
    public class SaleInfo {
        public int Year { get; set; }
        public double Value { get; set; }
    }
}
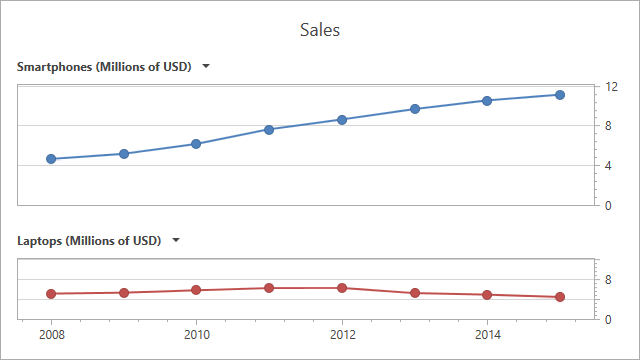
The image below shows the results:
Customize Pane Appearance
The pane appearance depends on the application (or chart) theme. To change the colors used to fill the pane area, use the following properties:
- Pane.Background (inherited from Control) - Specifies the pane’s background.
- Pane.DomainBrush - Gets or sets the color of the area between diagram axes.
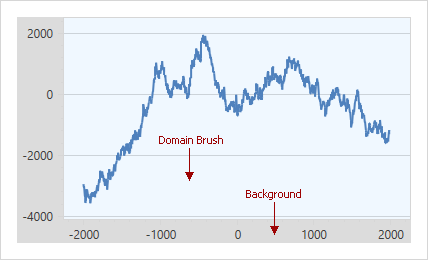
<dxc:Pane x:Name="defaultPane" Background="#FFDCDCDC" DomainBrush="AliceBlue">
See the Pane Layout help topic for information on how to configure multiple panes’ position and alignment.