Panes
- 2 minutes to read
A pane is an area within a 2D XY Diagram. A pane displays series, axes and other elements within a diagram.
The document consists of the following parts.
Overview
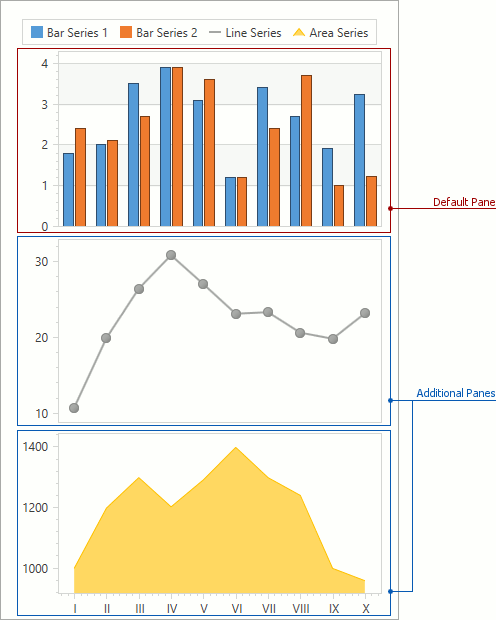
An individual pane is represented by the Pane class. After creation of an XY Diagram, by default, a diagram already contains a pane, which can be accessed using the XYDiagram2D.DefaultPane property.
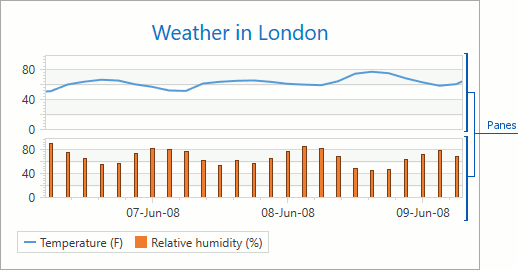
In certain cases, it is necessary to display series data using separate panes (e.g., to show values measured in different units across the same date-time axis). In this case, add a pane to the XYDiagram2D.Panes collection.
To specify a pane used to display a series, use the XYDiagram2D.SeriesPane property.
The Pane.Visibility property (inherited from System.Windows.UIElement) allows you to hide a pane with pane contents.
Separate Pane Adding
In certain cases, it is necessary to separate series to several panes to improve chart appearance.
To create an additional pane, use the following XAML.
<dxc:XYDiagram2D.Panes>
    <dxc:Pane x:Name="pane0"/>
</dxc:XYDiagram2D.Panes>
<dxc:LineSeries2D DisplayName="Series1">
<!--...-->
</dxc:LineSeries2D>
<dxc:BarSideBySideSeries2D DisplayName="Series2"
                           dxc:XYDiagram2D.SeriesPane="{Binding ElementName=pane0}">
<!--...-->
</dxc:BarSideBySideSeries2D>
The following image demonstrates the result of adding a pane.
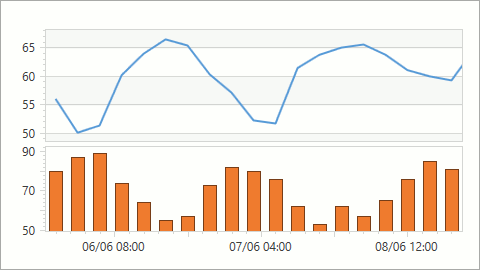
Note that secondary axes were used in a separate pane to improve chart data readability. To learn how to add secondary axes, refer to Primary and Secondary Axes.