FAQ
- 14 minutes to read
General Questions
Unlike most testing solutions, TestCafe Studio is not built on Selenium. This allows us to implement features you cannot find in Selenium-based tools (for example, testing remote devices without extra plugins and automatic waiting).
TestCafe Studio uses a URL rewrite proxy that allows the application to work without WebDriver. The proxy injects client-side automation scripts into the page.
| TestCafe | TestCafe Studio | |
|---|---|---|
| No need for WebDriver, browser plugins or other tools | ✓ | ✓ |
| Cross-platform and cross-browser out of the box | ✓ | ✓ |
| Write tests in the latest JavaScript or TypeScript | ✓ | ✓ |
| Clear and flexible API supports ES6 and PageModel pattern | ✓ | ✓ |
| Stable tests due to the Smart Assertion Query Mechanism | ✓ | ✓ |
| Tests run quickly due to intelligent Automatic Waiting Mechanism and Concurrent Test Execution | ✓ | ✓ |
| Custom reporter plugins | ✓ | ✓ |
| Use third-party Node.js modules in test scripts | ✓ | ✓ |
| Integration with popular CI systems | ✓ | ✓* |
| Visual Test Recorder | ✓ | |
| Interactive Test Editor | ✓ | |
| Automatic Selector Generation | ✓ | |
| Run Configuration Manager | ✓ | |
| IDE-like GUI | ✓ |
* You can use the open-source TestCafe test runner to integrate tests with CI systems.
You can find this information in our blog.
You can find a list of supported browsers in our documentation. TestCafe Studio is tested against the two latest versions of each browser (except browsers whose versions are specified explicitly in this list).
However, TestCafe Studio should work properly with browsers that support HTML5 and released in the last three years.
To view the current version number:
- MacOS: Open the TestCafe Studio menu and select the About command.
- Windows and Linux: Open the Help and select the About command.
This invokes the dialog that displays version information.
To download the latest version, visit our site.
For Windows and MacOS: When a newer version of TestCafe Studio is available, the notification appears on the main toolbar. Click the Install link to update to this version.

You can report a bug in our Support Center.
Testing
| Codeless Test | Test Script | |
|---|---|---|
| Consists of … | Test actions | JavaScript or TypeScript code |
| How do I create… | Record or manually compile from action templates | Record or write script code |
| How do I edit… | * Use the recorder to add new actions to an existing test * Add, update, and remove test actions in the Test Editor |
Use the Code Editor |
| How do I convert to another test type… | Can convert to JavaScript | Cannot convert to a codeless test |
| File extension | .testcafe | .js, .ts |
TestCafe allows you to record test scripts.
You can also create a codeless test, then convert it to JavaScript.
For more information about the difference between codeless tests and test scripts, see the previous question.
When you interact with a webpage during recording, TestCafe Studio automatically updates the test with corresponding actions. You can look at the editor to confirm that they are correct. For example:
TestCafe Studio generates a set of element selectors for a target element in a test action and adds one of them to the action parameters. Make sure that this element selector fits your needs, or select another one while recording.

You can also view the element that corresponds to this selector on the webpage. See Elements Highlighting.
- While recording, you can perform some extra actions that are unnecessary for your test, for example, clicks or key presses. TestCafe Studio records them too. These actions can increase the test duration and affect the test result. You can delete them from the test during recording.
After the test is recorded, run it to ensure it passes.
You can use third-party modules in both codeless tests and test scripts.
Use the import statement.
import fs from 'fs';

fixture `fixture`
    .page('http://localhost/testcafe/');

test('test', async t => {
    const filePath = 'filepath.js';

    await t.expect(fs.existsSync(filePath)).ok();
});
Use fixture.clientScripts or test.clientScripts in test scripts to inject a module into the tested page. You can use this module inside client functions and selectors.
test
    // Inject jquery.js as a client script
    .clientScripts('./jquery.js')
    ('test', async t => {
        const clientFunction = ClientFunction(() => {
            // You can use $ here
            return $('div').text();
        });

        const text = await clientFunction();
    });
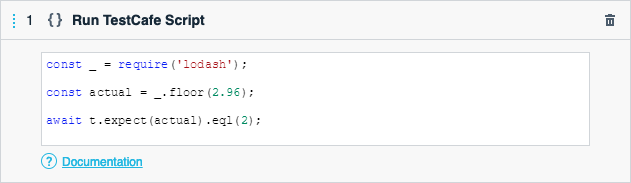
You can use third-party modules in codeless tests: include necessary require declarations in a Run TestCafe Script action.
There is no need to do this. TestCafe Studio clears browsing data before starting a test: cookies, local storages, and user profiles.
Codeless tests do not support user roles. However, you can convert your test to a test script and follow this guide.
Codeless tests cannot intercept HTTP request. However, you can convert your test to a test script and follow this guide.
Troubleshooting
On Linux, run TestCafe Studio from the command line. Open the directory where you copied the executable and run the following command:
./testcafe-studio
You should use the command line because certain Linux file managers, including GNOME’s Nautilus, do not launch raw binaries.
Some Linux versions, including CentOS and Arch Linux, may also throw the following error:
The SUID sandbox helper binary was found, but is not configured correctly. Rather than run without sandboxing I’m aborting now. You need to make sure that <testcafe-studio-dir>/chrome-sandbox is owned by root and has mode 4755.
To resolve this issue, go to the directory that contains TestCafe Studio executables (in the Terminal) and change the chrome-sandbox binary’s ownership and access permissions:
sudo chown root chrome-sandbox
sudo chmod 4755 chrome-sandbox
Use debug mode. Start TestCafe Studio from the command line with the debug flag:
Windows
"C:\Users\<username>\AppData\Local\Programs\TestCafe Studio\TestCafe Studio.exe" --debug
macOS
cd /Applications/"TestCafe Studio.app"
Contents/MacOS/"TestCafe Studio" --debug
Check if the console contains error messages. If so, take a screenshot and submit it to the Support Center.
Check PATH. On Windows, check if the %PATH% environment variable contains paths to system32 and powershell.
Check your antivirus. Antivirus software may block TestCafe Studio’s initial start. Launch TestCafe Studio once again. This action usually resolves the issue.
To work around issues that occur during online registration, register TestCafe Studio offline, and file a ticket that describes the issue in the Support Center.
Check your firewall. First, make sure that your firewall does not block ports that TestCafe Studio uses. TestCafe Studio chooses free ports automatically. You can specify custom ports in the Preferences/Settings Dialog and then allow connection to these ports in the firewall settings.
Check your proxy server. Another reason for this problem can be the proxy server you use to access the Internet. If your network is connected to the Web through a proxy, specify the proxy URL in the Preferences/Settings Dialog.
If the issue persists, submit a ticket to the Support Center.
Open the URL. Click Open Tested Page in the Test Editor toolbar or the page URL in the Fixture Editor. The website may be unavailable or the URL may be incorrect.
Use the recording browser. Try opening the tested page in the browser you use for recording if this browser is not your default.
Check the network configuration. Ensure that the hostname, port and proxy server settings are correct as described in the previous question.
Try a different test. Run a different test against the same page in TestCafe Studio and open-source TestCafe. Check if it runs without errors.
If the issue persists, submit a ticket to the Support Center.
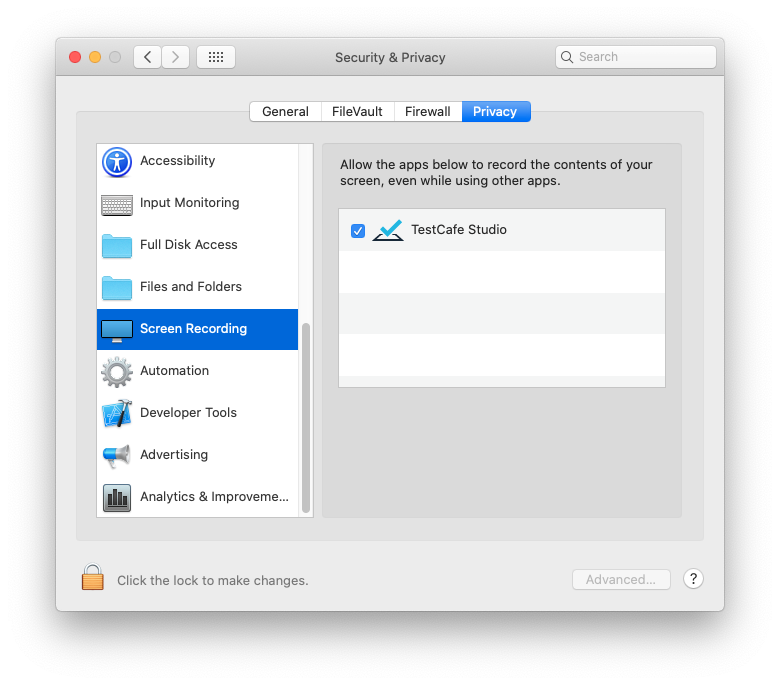
Open System Preferences > Security & Privacy > Privacy.
TestCafe Studio requires the following permissions:
- Automation permission for all installed browsers,
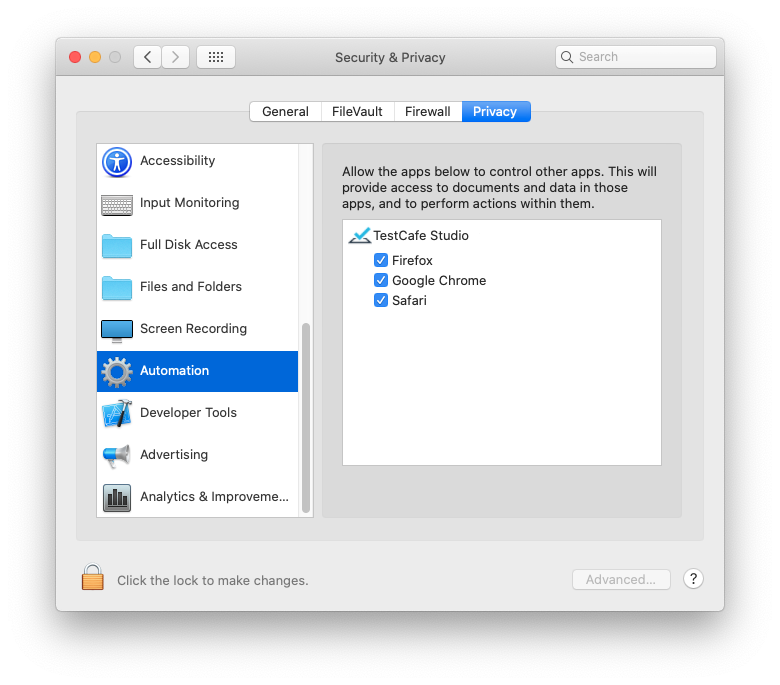
- Screen Recording permission (requires application restart).
If these permissions are already enabled, uncheck the check boxes, then check them again, and restart TestCafe Studio. If this does not fix the issue, execute the following command to reset permissions:
tccutil reset All com.devexpress.testcafestudio
MacOS will display dialog boxes with permission requests again when you run TestCafe Studio.
If the issue persists, submit a ticket to the Support Center.
After you start recording new steps in a test, TestCafe Studio replays the existing test actions. The playback is performed according to Record Configuration settings. Check these settings and adjust them so they match the Run Configuration.
TestCafe Studio does not fail when JavaScript errors occur on the page during recording. During test runs, this is controlled by the Fail if a JavaScript error occurs setting in the Run Configuration.
The most common reason for this is a JavaScript error on the tested page. Load this page in the browser, open the console and see if the page has any errors. In case there are errors, you can either fix them or disable the Fail if a JavaScript error occurs setting in the Run Configuration to skip them.
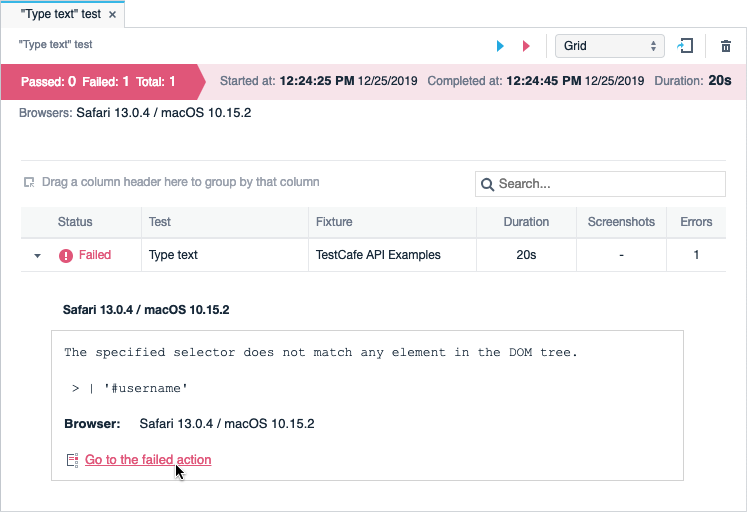
This happens when a test action Selector does not match any DOM element, the element is not visible, or another element overlaps the target element.
To determine the cause of this issue, do the following:
Codeless Tests
- Open the test run report, expand the failed test and click Go to the failed action.
- Click
 Record test actions to play back this test with Visual Test Recorder. When TestCafe Studio tries to execute a step that fails, it throws an error.
 - You can focus the selector input to highlight elements that match this selector in the browser. (Note, however, that TestCafe Studio does not scroll the page.) Perform this operation after each of the following steps to ensure that the selector is working correctly.
- You can use the Element Picker to re-generate the element’s selector (the current selector is rewritten). Click Pick a target element, select the target element in the browser, and run the test again.
- If the selector matches several elements, test actions and assertions are performed with the first element in the matched set. Append nth(0) to the selector and check whether the target element is highlighted. If it is not, add selector methods to pick the right element.
- Check that the target element is visible and the browser window is scrolled to this element’s position. If the page isn’t scrolled to the target element (but you can scroll it to the element manually), it may indicate that the page uses virtual scrolling. In this instance, add the Hover action to emulate hover over an element or area where virtual scrolling is triggered.
- Use the browser’s Developer Tools to check if the target element is inside an
<iframe>. If it is, add the Switch to Iframe action before the failed step to switch the browsing context (use the Element Picker to select the<iframe>). Ensure that the selector in the Switch to Iframe action identifies the correct<iframe>. - The target element may not be visible due to layout adaptivity. Try resizing the browser window and focus the selector input each time the layout changes. If the target element only displays at a specific width, use the Maximize Window and Resize Window actions to set a sufficient window size.
- In rare cases (complex animations or event handling), increased test speed during test run can cause failures. Specify a smaller value for the Speed option in the record or run configuration to slow down the test.
Test Scripts
- Open the test run report and expand the failed test. The error message in the test run report indicates which selector has failed.
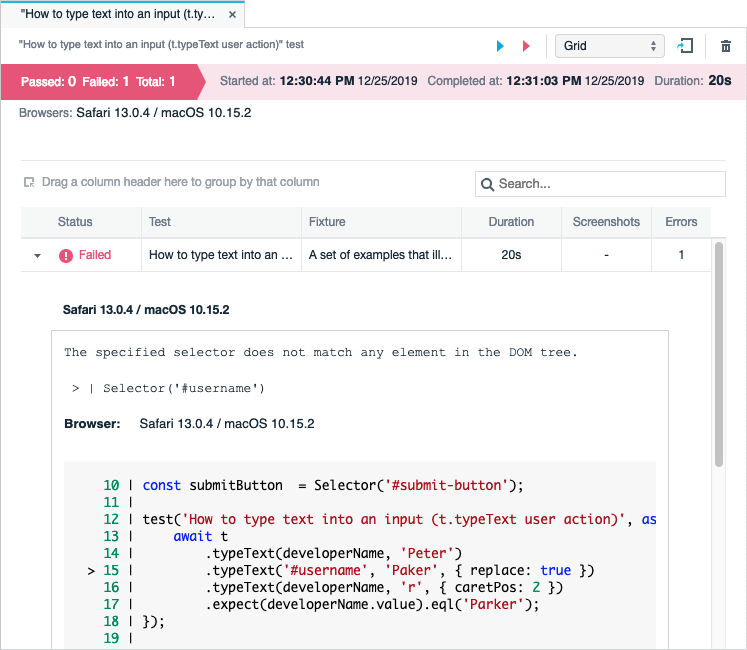
- Add the t.debug method before this selector to stop test execution before it reaches this point.
- Run the test and wait until the browser stops at the breakpoint.
- After this, use the browser’s Developer Tools to check that:
- the element is present on the page;
- the element and its parents are visible (TestCafe considers it visible if it does not have
displayset tonone,visibilityset tohiddenor the zerowidthorheight); - the element’s part targeted by the action is visible (the center of the element, or a point specified by the
offsetXandoffsetYparameters); - the element is not in an
<iframe>(if it is, use the t.switchToIframe method to switch to the appropriate<iframe>).
- Run the test in full screen mode. Use the t.maximizeWindow and t.resizeWindow actions to control the browser window size. If the test passes, it indicates that your webpage hides the target element when the window size is decreased.
- Decrease the Speed value in the run configuration to slow down the test.
You can also update TestCafe Studio to the latest version to see if the problem persists.
When TestCafe does not receive a successful response from a server, it outputs the following error:
A request to https://www.example.com has failed.
Use quarantine mode to perform additional attempts to execute this test.
You can use quarantine mode to complete tests if this problem occurs infrequently.
However, we recommend that you determine the cause of this issue and address it.
This error can occur in the following situations:
The Web server is not responding
Check if the Web and DNS servers are online and configured to accept requests to this URL.
Unstable or improperly configured network connection
- Check the network connection settings.
- Ensure that your network equipment works properly. If possible, establish a direct connection to the Internet/Web server.
- Check the proxy server’s settings or try a different proxy server.
- Use a VPN.
- Connect to a different network.
This can happen when the browser window is inactive or collapsed because macOS throttles browser windows in the background.
To fix this issue, keep the browser window at least partially visible during recording. If this is not possible, follow these steps to disable throttling:
- Ensure the Terminal has full access to the file system. Open System Preferences > Security & Privacy > Privacy > Full Disk Access and put a tick next to Terminal.
Enable the Debug menu in Safari with the following command:
defaults write com.apple.Safari IncludeInternalDebugMenu 1Restart Safari.
- Open the Debug menu and click Miscellaneous Flags > Disable Hidden Page Timer Throttling.
TestCafe Studio has the following features that facilitate identifying error causes:
- debug mode for step-by-step test execution during test recording and execution (you can add the Debug action, use record or run configuration settings to enable debug mode)
- screenshots to explore the tested page visually,
- adjustable test speed.
Many TestCafe Studio bugs, such as issues with test playback, stem from underlying product malfunction. To diagnose issues with the TestCafe Framework and the TestCafe Hammerhead reverse proxy, launch TestCafe Studio with the --trace-logs flag.
TestCafe Studio will generate a debug log and place it in the testcafe_output.log file in the root folder of your test project.
If you are unable to diagnose the issue with these techniques, you can run tests in the open-source TestCafe to record a video of the test run or take full-page screenshots.
Install TestCafe from npm and run tests from the command line. Do the following in testcafe command arguments:
- Enable video recording,
- Specify that TestCafe takes full-page screenshots to include areas hidden due to overflow.
You can also specify screenshot path patterns to use values like date, time, or browser name in subdirectory names.