TableColumn.Name Property
Gets or sets the name of the table column.
Namespace: DevExpress.Spreadsheet
Assembly: DevExpress.Spreadsheet.v18.2.Core.dll
Declaration
Property Value
| Type | Description |
|---|---|
| String | A String value that specifies the table column name. |
Remarks
Table names and table column names can be used in formulas to refer to the corresponding table data ranges. This allows you to work with table data more easily. For example, the =SUM(Products[Price]) formula calculates the sum of values contained in the Price column (TableColumn.Name = “Price”) of the Products table (Table.Name = “Products”).
If the Table.ShowHeaders property is set to true, column names are displayed in the header row at the top of the table.
Note
A column name should be unique within the Table.Columns collection.
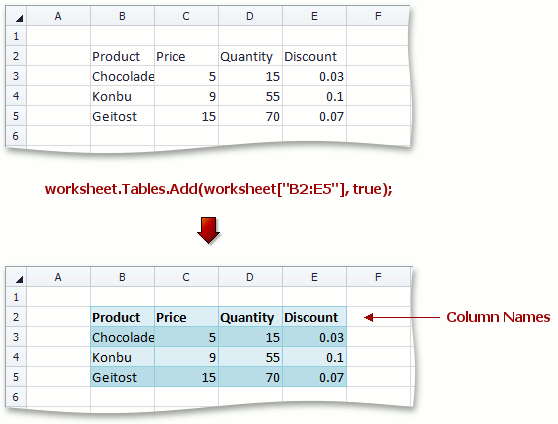
If you format the specific cell range as a table via the TableCollection.Add method and set the top row of this range to be displayed as the table header (the hasHeaders parameter value is true), the Name property of each column is automatically set to the string that represents the value of the corresponding cell in the table header.
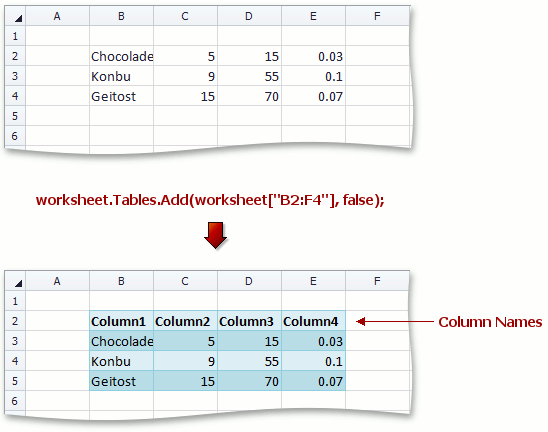
If any cell in the table header row initially has an empty value, or you do not set the top row of the table range to be displayed as the table header, column names (headers) are set to default values (Column1, Column2, etc.).
| Specified Column Names | Default Column Names |
|---|---|
 |
 |
To hide the table header row (column names), set the Table.ShowHeaders property to false.
Example
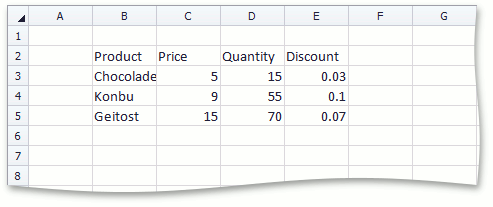
This example demonstrates how to create a table from a range of cells. The sample range includes a list of products and invoice information on each product: price, quantity and discount.
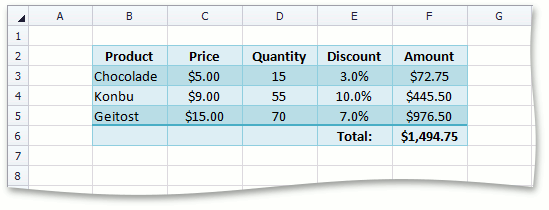
The resulting table will provide an additional column to calculate the amount per product, and an additional row to show the total amount. Follow the steps below:
Create a Table
Add a new Table object to the worksheet’s collection of tables (Worksheet.Tables) via the TableCollection.Add method. Pass the following parameters:
- The range of cells that you wish to format as a table. Use the “B2:F5” range reference instead of “B2:E5” to include an additional column to the right that calculates and displays product amounts.
- A Boolean value indicating that the top row of the specified range will be the table header.
Format the Table
Format the table by applying one of the built-in table styles. To do this, set the Table.Style property to the table style object from the IWorkbook.TableStyles collection. Access the desired style by its BuiltInTableStyleId identifier.
Table Columns
Access table columns by their indexes from the column collection that the Table.Columns property returns.
Table Header Row
To specify the last column header, set its
TableColumn.Nameproperty to “Amount”. Headers of other table columns are automatically set to the values of the corresponding cells:- table.Columns[0].Name = “Product”
- table.Columns[1].Name = “Price”
- table.Columns[2].Name = “Quantity”
- table.Columns[3].Name = “Discount”
Calculated Column
Specify the formula to calculate the product amount, and assign it to the Amount column using the TableColumn.Formula property. In the formula, refer to table columns by their headers.
Table Total Row
Set the Table.ShowTotals property to true, to display the total row at the bottom of the table.
Total Row Function
Specify the function to calculate the total amount. To do this, set the TableColumn.TotalRowFunction property of the Amount column to TotalRowFunction.Sum.
Note
In the total row, you can use any formulas you wish, not only functions listed by the TotalRowFunction enumerator. To use a custom formula in the total row, assign it to the TableColumn.TotalRowFormula property of the required table column.
Table Ranges and Data Ranges
Specify number formats to display numbers as currency values in the Price and Amount columns, and as percentage values in the Discount column. To access the data range of a table column, use the TableColumn.DataRange property.
Use the Table.HeaderRowRange and Table.TotalRowRange properties to access table header and total row ranges, and set the alignment.
Change the width of table columns. To do this, access the table range via the Table.Range property, and use its Range.ColumnWidthInCharacters property.
The image below shows the results.
Note
A complete sample project is available at https://github.com/DevExpress-Examples/winforms-spreadsheetcontrol-api-part-2-e4832
' Insert a table in the worksheet.
Dim table As Table = worksheet.Tables.Add(worksheet("B2:F5"), True)

' Format the table by applying a built-in table style.
table.Style = workbook.TableStyles(BuiltInTableStyleId.TableStyleMedium27)

' Access table columns and name them.
Dim productColumn As TableColumn = table.Columns(0)
productColumn.Name = "Product"
Dim priceColumn As TableColumn = table.Columns(1)
priceColumn.Name = "Price"
Dim quantityColumn As TableColumn = table.Columns(2)
quantityColumn.Name = "Quantity"
Dim discountColumn As TableColumn = table.Columns(3)
discountColumn.Name = "Discount"
Dim amountColumn As TableColumn = table.Columns(4)
amountColumn.Name = "Amount"

' Set the formula to calculate the amount per product
' and display results in the "Amount" column.
amountColumn.Formula = "=[Price]*[Quantity]*(1-[Discount])"

' Display the total row in the table.
table.ShowTotals = True

' Set the label and function to display the sum of the "Amount" column.
discountColumn.TotalRowLabel = "Total:"
amountColumn.TotalRowFunction = TotalRowFunction.Sum

' Specify the number format for each column.
priceColumn.DataRange.NumberFormat = "$#,##0.00"
discountColumn.DataRange.NumberFormat = "0.0%"
amountColumn.Range.NumberFormat = "$#,##0.00;$#,##0.00;"""";@"

' Specify horizontal alignment for header and total rows of the table.
table.HeaderRowRange.Alignment.Horizontal = SpreadsheetHorizontalAlignment.Center
table.TotalRowRange.Alignment.Horizontal = SpreadsheetHorizontalAlignment.Center

' Specify horizontal alignment to display data in all columns except the first one.
For i As Integer = 1 To table.Columns.Count - 1
    table.Columns(i).DataRange.Alignment.Horizontal = SpreadsheetHorizontalAlignment.Center
Next i

' Set the width of table columns.
table.Range.ColumnWidthInCharacters = 10