PivotDataField.SummarizeValuesBy Property
Gets or sets the summary function used to calculate values in the data field.
Namespace: DevExpress.Spreadsheet
Assembly: DevExpress.Spreadsheet.v18.2.Core.dll
Declaration
Property Value
| Type | Description |
|---|---|
| PivotDataConsolidationFunction | A PivotDataConsolidationFunction enumeration value that specifies the summary function used by the data field. |
Available values:
| Name | Description |
|---|---|
| Average | The average of the values.
|
| Count | The number of nonempty values. |
| CountNumbers | The number of numeric values. |
| Max | The largest value. |
| Min | The smallest value. |
| Product | The product of the values. |
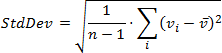
| StdDev | An estimate of the standard deviation of a population, where the sample is a subset of the entire population.
|
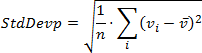
| StdDevp | The standard deviation of a population, where the population is all of the data to be summarized.
|
| Sum | The sum of the values. |
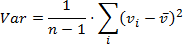
| Var | An estimate of the variance of a population, where the sample is a subset of the entire population.
|
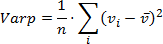
| Varp | The variance of a population, where the population is all of the data to be summarized.
|

Remarks
By default, when you add a numeric field to the data area, its values are summarized by the Sum function. For a text field or field containing blank cells, the Count function is used as the default summary function. However, you can select a different function to summarize values in the data field by setting the SummarizeValuesBy property to the required PivotDataConsolidationFunction enumeration value.
For example, the following code creates a pivot table that uses the “Average” function in the data field to show the average of sales values for each product.
Note
A complete sample project is available at https://github.com/DevExpress-Examples/winforms-spreadsheet-pivot-table-api-t298650
Dim sourceWorksheet As Worksheet = workbook.Worksheets("Data5")
Dim worksheet As Worksheet = workbook.Worksheets.Add()
workbook.Worksheets.ActiveWorksheet = worksheet

' Create a pivot table using the cell range "A1:E65" as the data source.
Dim pivotTable As PivotTable = worksheet.PivotTables.Add(sourceWorksheet("A1:E65"), worksheet("B2"))

' Add the "Category" field to the row axis area.
pivotTable.RowFields.Add(pivotTable.Fields("Category"))
' Add the "Product" field to the row axis area.
pivotTable.RowFields.Add(pivotTable.Fields("Product"))

' Add the "Amount" field to the data area.
Dim dataField As PivotDataField = pivotTable.DataFields.Add(pivotTable.Fields("Amount"))
' Use the "Average" function to summarize values in the data field.
dataField.SummarizeValuesBy = PivotDataConsolidationFunction.Average
' Specify the number format for the data field.
dataField.NumberFormat = "_([$$-409]* #,##0.00_);_([$$-409]* (#,##0.00);_([$$-409]* "" - ""??_);_(@_)"
Note that the selected summary function will be automatically used for the subtotals and grand totals in the report. To select a different function for the totals of a specific pivot field, use the PivotField.SetSubtotal method.
You can also change the way summaries are displayed in a pivot table by applying an additional calculation option to the raw summary values. To do this, use the PivotDataField.ShowValuesWithCalculation method overloads.
Related GitHub Examples
The following code snippets (auto-collected from DevExpress Examples) contain references to the SummarizeValuesBy property.
Note
The algorithm used to collect these code examples remains a work in progress. Accordingly, the links and snippets below may produce inaccurate results. If you encounter an issue with code examples below, please use the feedback form on this page to report the issue.