Series.Trendlines Property
Provides access to a collection of trendlines for the series.
Namespace: DevExpress.Spreadsheet.Charts
Assembly: DevExpress.Spreadsheet.v18.2.Core.dll
Declaration
Property Value
| Type | Description |
|---|---|
| TrendlineCollection | A TrendlineCollection object that is the collection of all the Trendline objects for the series. |
Remarks
The following code uses the TrendlineCollection.Add method to display a trendline of the ChartTrendlineType.Polynomial type.
Note
A complete sample project is available at https://github.com/DevExpress-Examples/spreadsheet-document-server-chart-api-t132724
Worksheet worksheet = workbook.Worksheets["chartTask3"];
workbook.Worksheets.ActiveWorksheet = worksheet;
// Create a chart and specify its location.
Chart chart = worksheet.Charts.Add(ChartType.ColumnStacked);
chart.SelectData(worksheet["C2:F3"], ChartDataDirection.Row);
chart.TopLeftCell = worksheet.Cells["H2"];
chart.BottomRightCell = worksheet.Cells["N14"];
// Show data labels.
chart.Views[0].DataLabels.ShowValue = true;
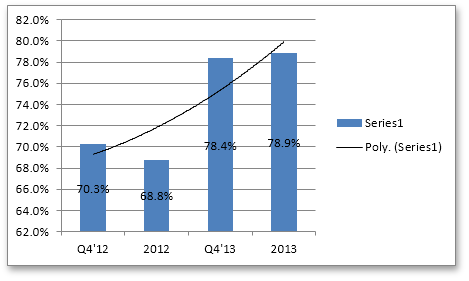
// Display a polynomial trendline.
chart.Series[0].Trendlines.Add(ChartTrendlineType.Polynomial);
The resulting chart is shown in the following picture.
See Also