Axis.Position Property
Gets or sets the axis position on the chart.
Namespace: DevExpress.Spreadsheet.Charts
Assembly: DevExpress.Spreadsheet.v23.2.Core.dll
NuGet Package: DevExpress.Spreadsheet.Core
Declaration
Property Value
| Type | Description |
|---|---|
| AxisPosition | An enumeration value that specifies the axis position. |
Available values:
| Name | Description |
|---|---|
| Bottom | Specifies that the axis must be displayed at the bottom of the plot area. |
| Left | Specifies that the axis must be displayed to the left of the plot area. |
| Right | Specifies that the axis must be displayed to the right of the plot area. |
| Top | Specifies that the axis must be displayed at the top of the plot area. |
Remarks
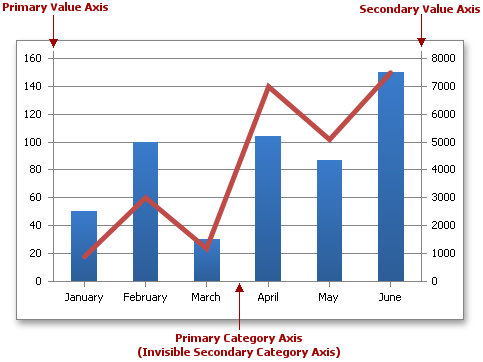
When you set the Position property, it is necessary to take into account the default position settings for different chart types. Most charts display the primary category axis running horizontally along the bottom of the plot area and the primary value axis running vertically on the left side of the chart. If the chart has the secondary axes, the secondary category axis, as a rule, coincides with the primary category axis and stays invisible on the chart. The secondary value axis is displayed on the right side of the plot area.
The default settings for the bar chart differ from the other chart types. The bar chart reverses the position of primary axes by displaying the category axis vertically to the left of the plot area and the value axis horizontally at the bottom of the chart. The secondary category axis is not displayed if it coincides with the primary category axis, and the secondary value axis is shown at the top of the plot area.

The scatter and bubble charts (which use only value axes) display the primary X-axis at the bottom of the plot area and the primary Y-axis to the left of the chart, while the secondary X-axis and Y-axis are shown at the top and to the right of the plot area, respectively.

However, you can use the Position property to change the default axis position. Note that only a value that is opposite to the default value affects the chart appearance. For example, you can display the primary value axis in a column chart to the right of the plot area, as shown in the code snippet below. When you set the Position property for the axis, the Spreadsheet evaluates the intersection point with the associated axis depending on its position and orientation (AxisScaling.Orientation). You can also use the Axis.CrossType property to explicitly specify the axis intersection point.
The Position property is available only for the category and value axes and you cannot change the position of the series axis in a 3-D chart.
Note
The Position property is ignored if the AxisScaling.Orientation property is specified.
Example
The example below demonstrates how to create a chart and specify its y-axis position using the Axis.Position property.
Worksheet worksheet = workbook.Worksheets["chartTask3"];
workbook.Worksheets.ActiveWorksheet = worksheet;

// Create a chart and specify its location.
Chart chart = worksheet.Charts.Add(ChartType.ColumnClustered, worksheet["B3:C5"]);
chart.TopLeftCell = worksheet.Cells["H2"];
chart.BottomRightCell = worksheet.Cells["N14"];

// Set the position of the value axis.
chart.PrimaryAxes[1].Position = AxisPosition.Right;

// Hide the legend.
chart.Legend.Visible = false;
Related GitHub Examples
The following code snippets (auto-collected from DevExpress Examples) contain references to the Position property.
Note
The algorithm used to collect these code examples remains a work in progress. Accordingly, the links and snippets below may produce inaccurate results. If you encounter an issue with code examples below, please use the feedback form on this page to report the issue.