How to: Apply a Custom Calculation to a Data Field
- 4 minutes to read
Summaries in the data area are calculated according to the data field’s PivotDataField.SummarizeValuesBy property. By default, they are displayed “as is”. However, you can use the PivotDataField.ShowValuesWithCalculation method overloads to apply an additional calculation option to the raw summary values to change the way they are displayed in the PivotTable report.
The available calculation options are defined by the values of the PivotShowValuesAsType enumeration and listed in the table below. Depending on the selected option, you may need to specify either a base field or a base field and its base item that will serve as a basis for a custom calculation. Only a field from the row or column area can be used as a base field, otherwise, all results will be shown as a #N/A error.
Calculation Option | PivotShowValuesAsType Member | Description |
|---|---|---|
% of Grand Total | Displays values as the percentage of the grand total of all values in the PivotTable report. | |
% of Column Total | Displays values in each column as the percentage of the total value of the column. | |
% of Row Total | Displays values in each row as the percentage of the total value of the row. | |
% of Parent Column Total | Displays values in each inner column as the percentage of the total of the parent item in the outer column. | |
% of Parent Row Total | Displays values in each inner row as the percentage of the total of the parent item in the outer row. | |
Index | Calculates the relative importance of each summary value by using the following formula: ((value in cell) x (Grand Total of Grand Totals)) / ((Grand Row Total) x (Grand Column Total)) | |
% of Parent Total | Displays values in a data field as the percentage of the value of the parent item in the specified base field. | |
Rank Smallest to Largest | Displays the rank of values for a specific base field, listing the smallest item in the field as 1, and each larger value with a higher rank value. | |
Rank Largest to Smallest | Displays the rank of values for a specific base field, listing the largest item in the field as 1, and each smaller value with a higher rank value. | |
Running Total In | Displays values for successive items in the base field as a running total. | |
% Running Total In | Calculates a running total for successive items in the base field as a percentage of the grand total value. | |
% Of | Displays values as the percentage of the value of the base item in the base field. | |
Difference From | Displays values as the difference from the value of the base item in the base field. | |
% Difference From | Displays values as the percentage difference of the value of the base item in the base field. |
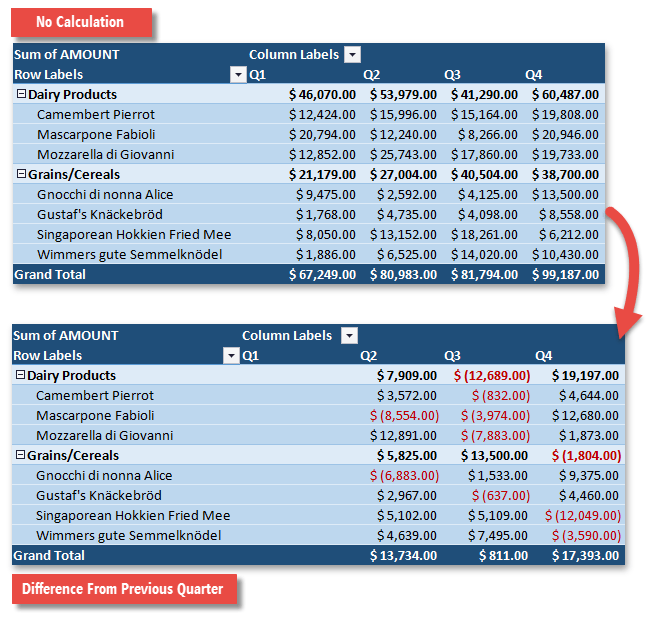
To remove any custom calculation applied to a data field, pass the PivotShowValuesAsType.NoCalculation enumeration member to the PivotDataField.ShowValuesWithCalculation method as a parameter, or call the PivotDataField.ShowValuesWithoutCalculation method.
The following example demonstrates how to calculate the difference in product sales between the current quarter and the previous quarter. Values in the data field are summarized using the “Sum” function.
Note
A complete sample project is available at https://github.com/DevExpress-Examples/spreadsheet-document-server-pivot-table-api-t501894
Worksheet worksheet = workbook.Worksheets["Report14"];
workbook.Worksheets.ActiveWorksheet = worksheet;

// Access the pivot table by its name in the collection
PivotTable pivotTable = worksheet.PivotTables["PivotTable1"];

// Access the data field by its index in the collection.
PivotDataField dataField = pivotTable.DataFields[0];
// Display the difference in product sales between the current quarter and the previous quarter.
dataField.ShowValuesWithCalculation(PivotShowValuesAsType.Difference, pivotTable.Fields["Quarter"], PivotBaseItemType.Previous);
The image below shows the result.