How to: Specify Sparkline Axis Settings
- 3 minutes to read
Horizontal Axis Options
Visibility
Set the XlSparklineGroup.DisplayXAxis property to true to display the horizontal axis on a sparkline. Use the XlSparklineGroup.ColorAxis property to specify the axis color.
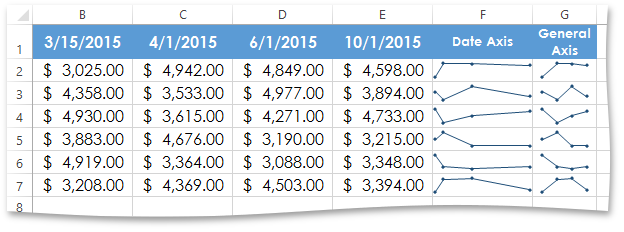
Axis Type
A sparkline uses the general axis type by default - the axis is inferred from the data range, and data points are displayed at regular intervals. However, if the underlying data occurs at irregular periods, you can reflect these time intervals on a sparkline using the date axis type that changes the space between data markers proportionally to the time intervals. Assign the cell range containing date values for the required sparkline group to the XlSparklineGroup.DateRange property to change the axis type to date axis.
Note
A complete sample project is available at https://github.com/DevExpress-Examples/xl-export-api-examples-t253492
// Create a group of line sparklines. XlSparklineGroup group = new XlSparklineGroup(XlCellRange.Parse("B2:E7"), XlCellRange.Parse("F2:F7")); // Specify the date range for the sparkline group. group.DateRange = XlCellRange.Parse("B1:E1"); // Set the sparkline weight. group.LineWeight = 1.25; // Display data markers on the sparklines. group.DisplayMarkers = true; sheet.SparklineGroups.Add(group);Plotting Order
You can change the direction in which data is plotted in each sparkline of a sparkline group. Set the XlSparklineGroup.RightToLeft property to true to display data in reverse (right-to-left) direction.
Vertical Axis Options
You can specify how to calculate the minimum and maximum values for the vertical axis using one of the following options:
- Automatic. Values are calculated individually for each sparkline in the group based on the lowest and highest values in the sparkline data range. Set the XlSparklineGroup.MinScaling and XlSparklineGroup.MaxScaling properties to the XlSparklineAxisScaling.Individual value to use this option.
- Identical. All sparklines in the group use the same scale that is automatically calculated based on the lowest and highest values in the group data range. Set the XlSparklineGroup.MinScaling and XlSparklineGroup.MaxScaling properties to the XlSparklineAxisScaling.Group value to use this option.
Custom. Specifies custom values for the vertical axis. Set the XlSparklineGroup.MinScaling and XlSparklineGroup.MaxScaling properties to the XlSparklineAxisScaling.Custom value to use custom scaling. Afterwards, assign the minimum value to the XlSparklineGroup.ManualMin property and the maximum value to the XlSparklineGroup.ManualMax property.
The example below demonstrates how to specify custom scaling values for a sparkline group’s vertical axis.
Note
A complete sample project is available at https://github.com/DevExpress-Examples/xl-export-api-examples-t253492
// Create a sparkline group.
XlSparklineGroup group = new XlSparklineGroup(XlCellRange.FromLTRB(1, 1, 4, 6), XlCellRange.FromLTRB(5, 1, 5, 6));
// Set the sparkline color.
group.ColorSeries = XlColor.FromTheme(XlThemeColor.Accent1, 0.0);
// Change the sparkline group type to "Column".
group.SparklineType = XlSparklineType.Column;
// Set the custom minimum value for the vertical axis.
group.MinScaling = XlSparklineAxisScaling.Custom;
group.ManualMin = 1000.0;
// Set the automatic maximum value for all sparklines in the group.
group.MaxScaling = XlSparklineAxisScaling.Group;
sheet.SparklineGroups.Add(group);