Sparklines
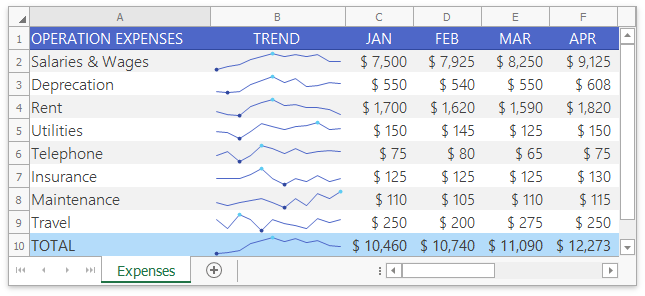
This section contains examples that demonstrate how to create sparklines and adjust their settings. A sparkline is a tiny chart located in a worksheet cell and used to show trends in a row or column of data. Sparklines are useful when you wish to perform an at-a-glance overview of data without needing to use the cumbersome charting functionality.