How to: Show or Hide the Chart Legend
- 3 minutes to read
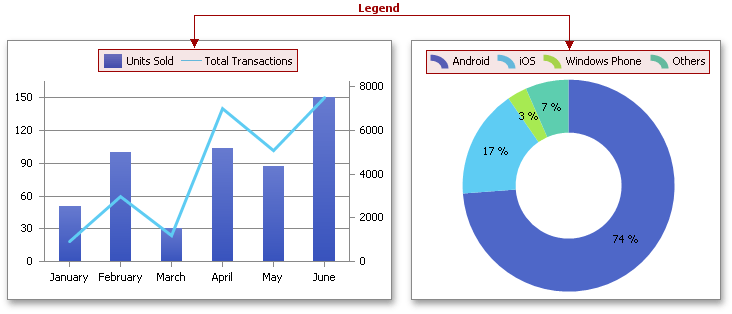
After you create a chart, its legend appears by default. A chart legend is a box that identifies data series displayed on a chart. In most cases, the legend displays series names, but in a pie or doughnut chart it shows data points of a single series. The legend also adds a sample of the line style, color and fill pattern used to draw the series on the chart.
The chart legend is defined by the Legend object, which can be accessed by utilizing the ChartObject.Legend property. To specify the legend placement, use the Legend.Position property. By default, the legend does not overlap the chart. However, to save space in the chart, you can turn this option off by setting the Legend.Overlay property to true. To remove the legend completely, set the Legend.Visible property to false.
Note
A complete sample project is available at https://github.com/DevExpress-Examples/spreadsheet-document-server-chart-api-t132724
Worksheet worksheet = workbook.Worksheets["chartTask3"];
workbook.Worksheets.ActiveWorksheet = worksheet;

// Create a chart and specify its location.
Chart chart = worksheet.Charts.Add(ChartType.ColumnClustered, worksheet["B2:F6"]);
chart.TopLeftCell = worksheet.Cells["H2"];
chart.BottomRightCell = worksheet.Cells["N14"];

// Specify the position of the legend.
chart.Legend.Position = LegendPosition.Bottom;
Change a Legend Entry
You can also modify the individual legend entries by utilizing the Legend.CustomEntries property, which provides access to the collection of customized legend entries (LegendEntryCollection). For example, to hide a legend entry, add a LegendEntry instance to the collection with the index set to the index of the selected entry. Next, set the LegendEntry.Hidden property to true. You can also change the font attributes of an individual entry by utilizing the LegendEntry.Font property.
The example below demonstrates how to remove the required entries from the chart legend by utilizing the Legend.CustomEntries property.
Note
A complete sample project is available at https://github.com/DevExpress-Examples/spreadsheet-document-server-chart-api-t132724
Worksheet worksheet = workbook.Worksheets["chartTask3"];
workbook.Worksheets.ActiveWorksheet = worksheet;

// Create a chart and specify its location.
Chart chart = worksheet.Charts.Add(ChartType.ColumnClustered, worksheet["B2:F6"]);
chart.TopLeftCell = worksheet.Cells["H2"];
chart.BottomRightCell = worksheet.Cells["N14"];

// Exclude entries from the legend.
chart.Legend.CustomEntries.Add(2).Hidden = true;
chart.Legend.CustomEntries.Add(3).Hidden = true;