How to: Display and Format Data Labels
- 8 minutes to read
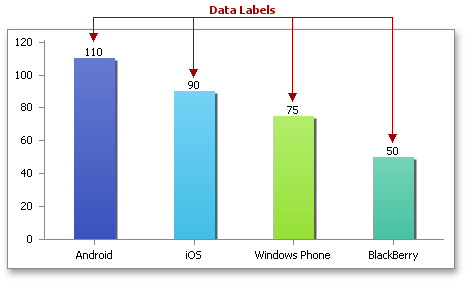
After you create a chart, you can add a data label to each data point in the chart to identify its actual value. By default, data labels are linked to data that the chart uses. When data changes, information in the data labels is updated automatically. If required, you can also display custom information in a label.
Select the action you wish to perform.
- Add Data Labels to the Chart
- Specify the Position of Data Labels
- Apply Number Format to Data Labels
- Create a Custom Label Entry
Add Data Labels to the Chart
Basic settings that specify the contents, position and appearance of data labels in the chart are defined by the DataLabelOptions object, accessed by the ChartView.DataLabels property. Use the object’s properties to display data labels for all series in the current chart view and specify what information should appear in each label. The following options are available:
- Value. Value labels identify the underlying value of each data point. To display value labels, set the DataLabelBase.ShowValue property of the DataLabelOptions object to true.
- Series name. Series labels identify data series to which the data points in the chart belong. Most series include multiple data points, so the same name will be repeated for all data points in the series, which is probably overkill. However, if you wish to display series name labels, utilize the DataLabelBase.ShowSeriesName property of the DataLabelOptions object.
- Category name. Category labels repeat information of the category axis labels. This option can be useful if you wish to display the category names for charts that do not have a category axis, like a pie or doughnut chart. To display the category labels, use the DataLabelBase.ShowCategoryName property.
- Percentage. Percentage labels are available for the pie and doughnut chart types only. They display a percentage calculated by using the basic formula that divides the data point value by the total of all values in the series. To add the percentage labels, utilize the DataLabelBase.ShowPercent property.
- Bubble size. Bubble size labels display the bubble size value in a bubble chart. Since the bubble size is a third dimension that does not correspond to any axis and is shown as a filled shape of a particular size, you can identify its value by displaying the bubble size labels at each data point. To do this, use the DataLabelBase.ShowBubbleSize property.
- Legend key. Legend key adds a sample of the color and fill pattern used to draw the corresponding series in a chart. To display the legend key next to each data label, utilize DataLabelBase.ShowLegendKey property.
If you use a combination of data label entries, you can specify a character to separate different items in a label by using the DataLabelBase.Separator property. The most frequently used separators are comma, semicolon, period, new line and space. However, you can specify a custom separator.
The example below demonstrates how to create a pie chart and adjust the display settings of its data labels. In particular, set the DataLabelBase.ShowCategoryName and DataLabelBase.ShowPercent properties to true to display the category name and percentage value in a data label at the same time. To separate these items, assign a new line character to the DataLabelBase.Separator property, so the percentage value will be automatically wrapped to a new line.
Note
A complete sample project is available at https://github.com/DevExpress-Examples/spreadsheet-document-server-chart-api-t132724
Worksheet worksheet = workbook.Worksheets["chartTask1"];
workbook.Worksheets.ActiveWorksheet = worksheet;

// Create a chart and specify its location.
Chart chart = worksheet.Charts.Add(ChartType.Pie, worksheet["B2:C7"]);
chart.TopLeftCell = worksheet.Cells["E2"];
chart.BottomRightCell = worksheet.Cells["K15"];

// Display the category name and percentage.
DataLabelOptions dataLabels = chart.Views[0].DataLabels;
dataLabels.ShowCategoryName = true;
dataLabels.ShowPercent = true;
dataLabels.Separator = "\n";

// Set the chart style.
chart.Style = ChartStyle.ColorGradient;
// Hide the legend.
chart.Legend.Visible = false;
// Set the angle of the first pie-chart slice.
chart.Views[0].FirstSliceAngle = 100;
Specify the Position of Data Labels
When there are many data points in a series or the label text is too long, the data labels may overlap, making the chart unreadable. To avoid this, you can adjust the positions of data labels by using the DataLabelBase.LabelPosition property. Depending on the chart type, assign one of the DataLabelPosition enumeration values to the LabelPosition property to specify the placement of data labels relative to their data markers.
The example below demonstrates how to create the clustered column chart and display its data labels by setting the DataLabelBase.ShowValue property to true. To specify the location of data labels on the chart, use the DataLabelBase.LabelPosition property. In this example, the DataLabelPosition.Center value is used, so data labels will be displayed centered inside columns.
Note
A complete sample project is available at https://github.com/DevExpress-Examples/spreadsheet-document-server-chart-api-t132724
Worksheet worksheet = workbook.Worksheets["chartTask3"];
workbook.Worksheets.ActiveWorksheet = worksheet;

// Create a chart and specify its location.
Chart chart = worksheet.Charts.Add(ChartType.ColumnClustered, worksheet["B2:D4"]);
chart.TopLeftCell = worksheet.Cells["H2"];
chart.BottomRightCell = worksheet.Cells["N14"];

// Display data labels and specify their position within the chart.
chart.Views[0].DataLabels.ShowValue = true;
chart.Views[0].DataLabels.LabelPosition = DataLabelPosition.Center;
Apply Number Format to Data Labels
You can specify how to display numeric values in data labels by applying number formats. A number in a data label can appear as a percentage, decimal, currency, scientific, fraction, text, accounting, date, time, or custom value. To apply a number format to data labels, utilize the DataLabelBase.NumberFormat property, which provides access to the NumberFormatOptions object containing format options for displaying numbers in different chart elements. Next, assign the corresponding number format code to the NumberFormatOptions.FormatCode property. Set the NumberFormatOptions.IsSourceLinked property to false to indicate that the applied format differs from the number format of the worksheet cell containing the data point value.
The example below demonstrates how to create a clustered column chart and format numeric values displayed in data labels as percentage values. To apply the number format, set the NumberFormatOptions.IsSourceLinked property to false and assign the corresponding format code to the NumberFormatOptions.FormatCode property.
Note
A complete sample project is available at https://github.com/DevExpress-Examples/spreadsheet-document-server-chart-api-t132724
Worksheet worksheet = workbook.Worksheets["chartTask3"];
workbook.Worksheets.ActiveWorksheet = worksheet;

// Create a chart and specify its location.
Chart chart = worksheet.Charts.Add(ChartType.ColumnClustered, worksheet["B2:D4"]);
chart.TopLeftCell = worksheet.Cells["H2"];
chart.BottomRightCell = worksheet.Cells["N14"];

// Display data labels and specify their position within the chart.
chart.Views[0].DataLabels.ShowValue = true;
chart.Views[0].DataLabels.LabelPosition = DataLabelPosition.Center;

// Format data labels.
chart.Views[0].DataLabels.NumberFormat.FormatCode = "0%";
chart.Views[0].DataLabels.NumberFormat.IsSourceLinked = false;
Create a Custom Label Entry
Displaying labels for all data series in the current view can make the chart overcrowded. However, you can avoid this by displaying labels for a particular series or individual data points. An individual data label is defined by the DataLabel object that is stored in the collection of customized data labels. To display data labels for a specific series, access the DataLabelCollection by using the Series.CustomDataLabels property, then use the collection’s properties to show and modify the data labels. To indicate that custom data labels are used, set the Series.UseCustomDataLabels property to true.
To display an individual data label, add a DataLabel instance to the DataLabelCollection collection with the index set to the index of the selected data point. Next, set the label’s DataLabelBase.ShowValue property (or any other DataLabelBase.Show* property depending on the information you wish to display in the label) to true. You can also specify the custom text for a data label by using the DataLabel.Text property, which provides access to the ChartText object. Use the ChartText.SetValue method to specify a new text for a data label, or utilize the ChartText.SetReference method to retrieve the text for a label from the worksheet cell.
Note
A complete sample project is available at https://github.com/DevExpress-Examples/spreadsheet-document-server-chart-api-t132724
Worksheet worksheet = workbook.Worksheets["chartTask3"];
workbook.Worksheets.ActiveWorksheet = worksheet;

// Create a chart and specify its location.
Chart chart = worksheet.Charts.Add(ChartType.ColumnClustered, worksheet["B2:D4"]);
chart.TopLeftCell = worksheet.Cells["H2"];
chart.BottomRightCell = worksheet.Cells["N14"];

// Display the data label for the last point of the second series.
chart.Series[1].CustomDataLabels.Add(1).ShowValue = true;
chart.Series[1].UseCustomDataLabels = true;