NumericAxisY Class
The y-axis that uses numeric scale and represents values of series data points.
Namespace: DevExpress.XamarinForms.Charts
Assembly: DevExpress.XamarinForms.Charts.dll
Declaration
public class NumericAxisY :
    AxisBase
Related API Members
The following members return NumericAxisY objects:
Remarks
ChartView creates default axes based on series data. To customize a y-axis, assign a NumericAxisY object with the specified axis settings to the ChartView.AxisY property.
The NumericAxisY class properties allow you to configure the axis’s range, scale parameters, labels, title, constant lines, strips, grid lines, tickmarks and interlacing colors, and change the axis position.
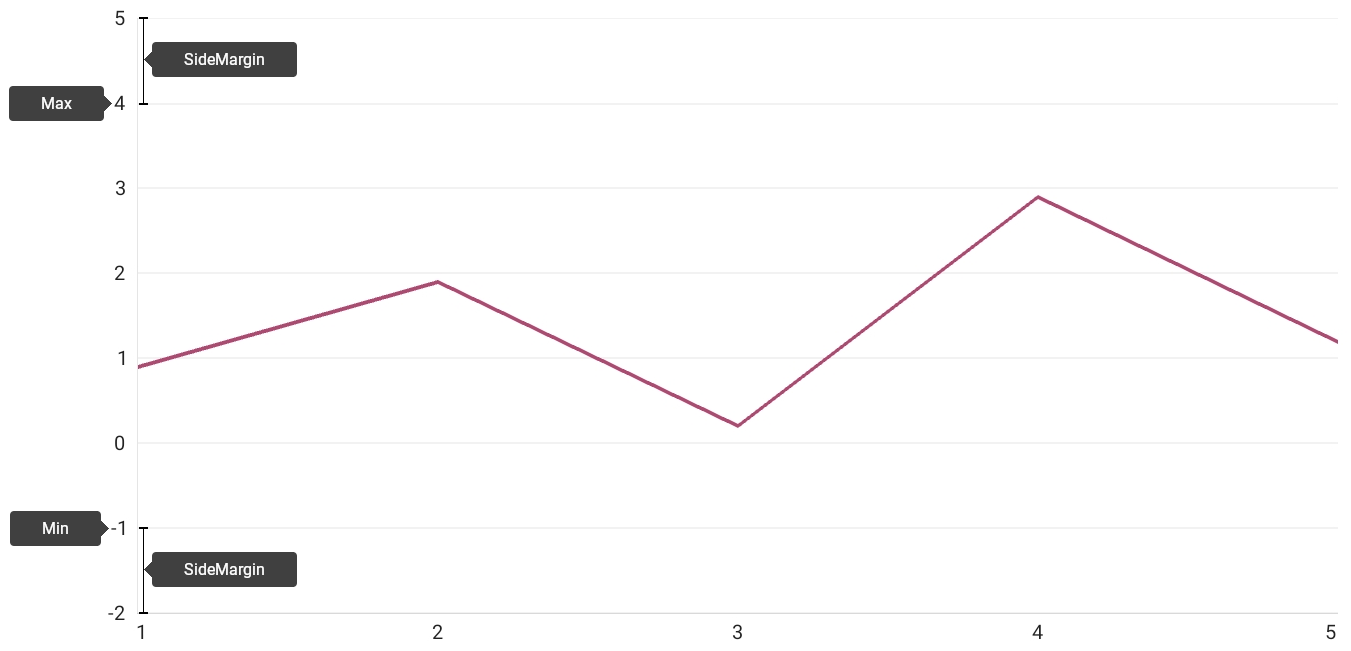
Axis Range
ChartView automatically calculates a y-axis range based on data series values. You can set a custom range for the axis. There are two types of axis ranges - whole range and visual range.
This example shows how to configure the numeric y-axis scale range. To do this, assign a NumericRange object with the specified properties to the NumericAxisY.Range property.
Whole Range and Side Margins
Use the Min and Max properties to specify the whole range of the axis scale. A chart does not visualize data that is out of this range. An end user can scroll the chart through this range when scrolling is enabled for the y-axis (ChartView.AxisYNavigationMode).
Use the RangeBase.SideMargin property to specify the value of indents on both sides of the axis.
<dxc:ChartView>
    <dxc:ChartView.AxisY>
        <dxc:NumericAxisY>
            <dxc:NumericAxisY.Range>
                <dxc:NumericRange Min="-1" Max="4" SideMargin="1"/>
            </dxc:NumericAxisY.Range>
        </dxc:NumericAxisY>
    </dxc:ChartView.AxisY>
</dxc:ChartView>
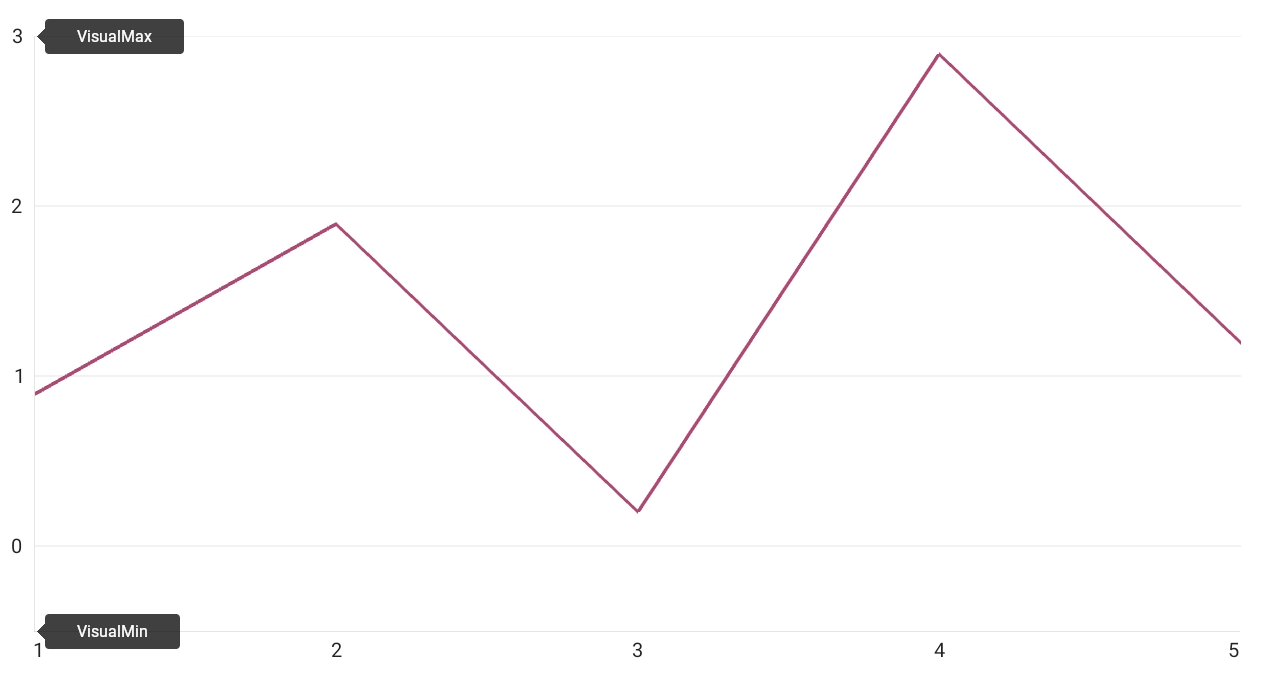
Visual Range
Use the VisualMin and VisualMax properties to set an axis scale range currently displayed on a screen.
<dxc:ChartView>
    <dxc:ChartView.AxisY>
        <dxc:NumericAxisY>
            <dxc:NumericAxisY.Range>
                <dxc:NumericRange VisualMin="-0.5" VisualMax="3"/>
            </dxc:NumericAxisY.Range>
        </dxc:NumericAxisY>
    </dxc:ChartView.AxisY>
</dxc:ChartView>
Axis Scale Parameters
This example shows how to configure a numeric y-axis scale and set the following parameters:
- GridAlignment - the distance between major tickmarks and gridlines.
- GridOffset - the offset of the first major tickmark and gridline from the axis range minimum value (0, in this example).
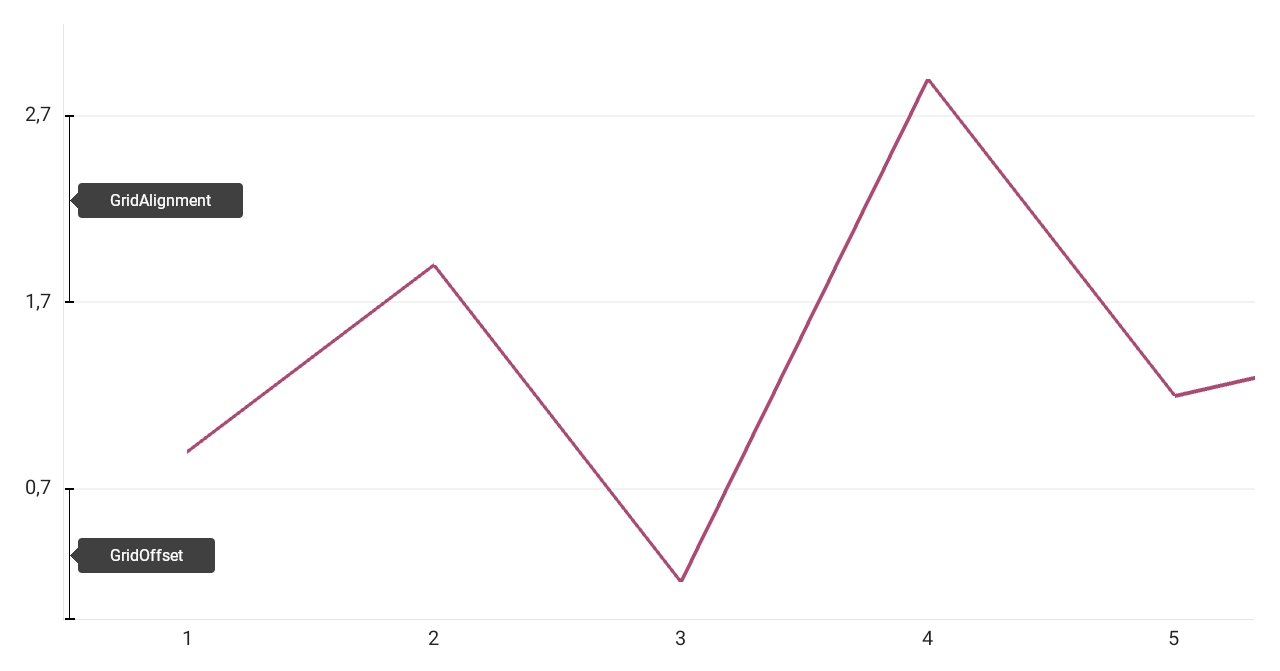
<dxc:ChartView>
  <dxc:ChartView.AxisY>
      <dxc:NumericAxisY GridAlignment="1" GridOffset="0.7"/>
  </dxc:ChartView.AxisY>
</dxc:ChartView>
Axis Labels
Axis labels display values at major tickmarks. They are automatically generated based on series data.
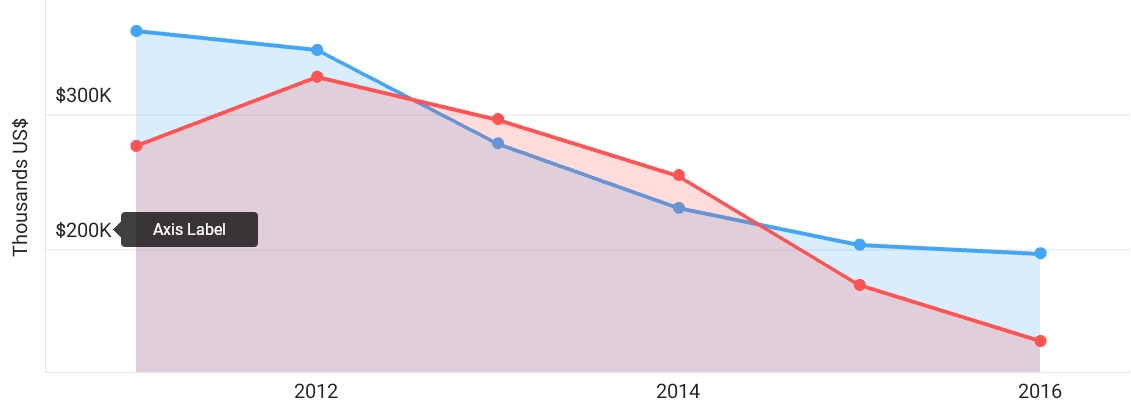
To configure y-axis labels, assign the AxisLabel object with the specified properties to the axis’s Label property.
<dxc:ChartView>
  <dxc:ChartView.AxisY>
      <dxc:NumericAxisY>
          <dxc:NumericAxisY.Label>
            <dxc:AxisLabel TextFormat="$#K" Position="Inside"/>
          </dxc:NumericAxisY.Label>
      </dxc:NumericAxisY>
  </dxc:ChartView.AxisY>
</dxc:ChartView>
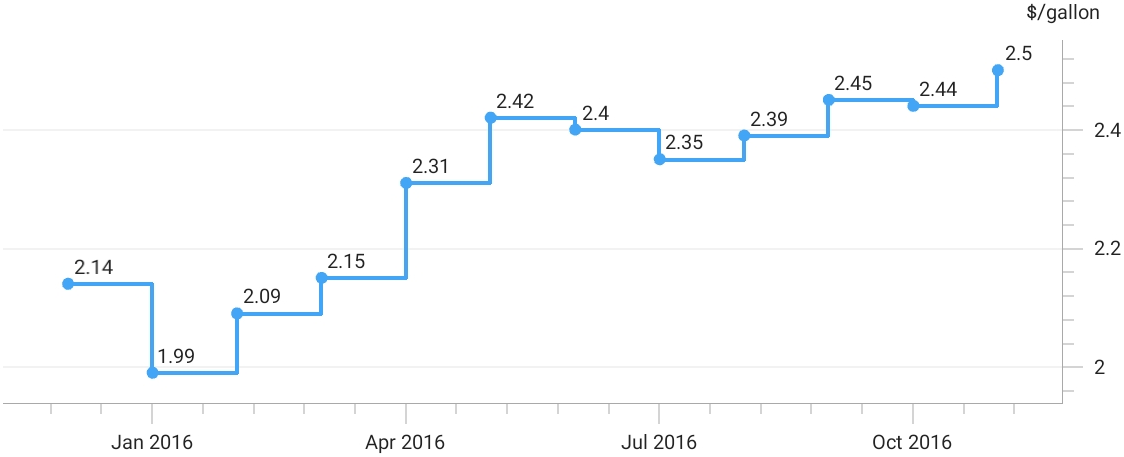
Axis Title
Use the NumericAxisY.Title property to access the y-axis’s title settings.
This example demonstrates how to create a y-axis’s title, align it and customize its appearance.
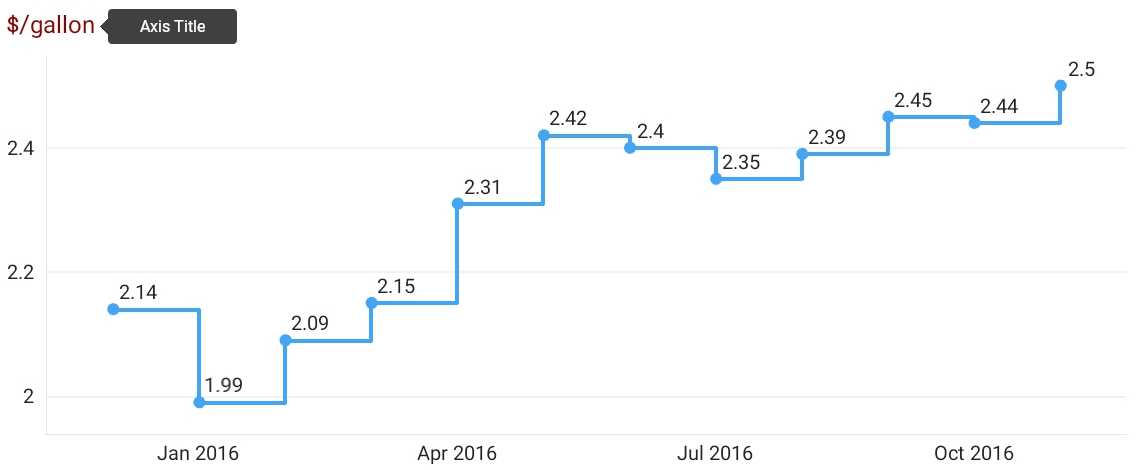
<dxc:ChartView.AxisY>
    <dxc:NumericAxisY>
        <dxc:NumericAxisY.Title>
            <dxc:AxisTitle Text="$/gallon"
                           Alignment="Outside">
                <dxc:AxisTitle.Style>
                    <dxc:TitleStyle>
                        <dxc:TitleStyle.TextStyle>
                            <dxc:TextStyle Color="DarkRed" Size="24"/>
                        </dxc:TitleStyle.TextStyle>
                    </dxc:TitleStyle>
                </dxc:AxisTitle.Style>
            </dxc:AxisTitle>
        </dxc:NumericAxisY.Title>
    </dxc:NumericAxisY>
</dxc:ChartView.AxisY>
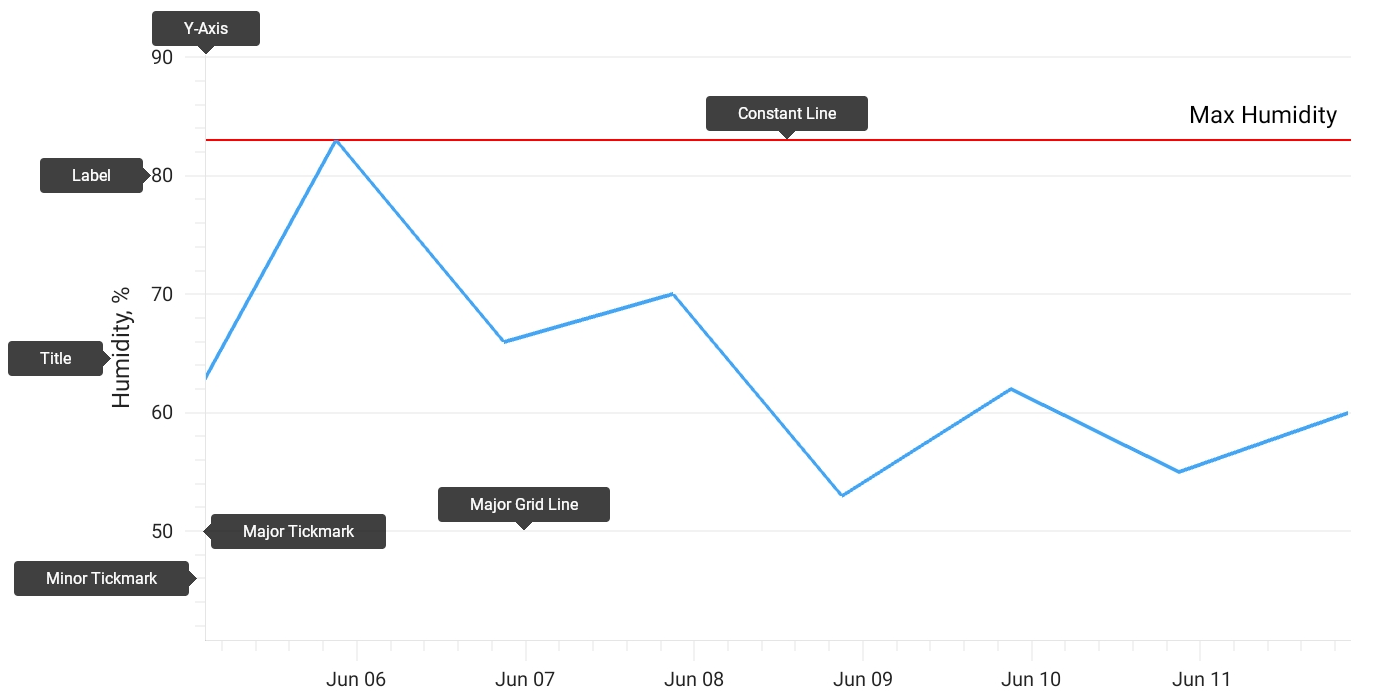
Constant Lines
You can use a constant line to visually represent an axis value as a line perpendicular to the y-axis.
This example shows how to add a constant line to a numeric y-axis, customize its appearance and show it in the chart legend. To do this, add a NumericConstantLine object with the specified properties to the NumericAxisY.ConstantLines collection.
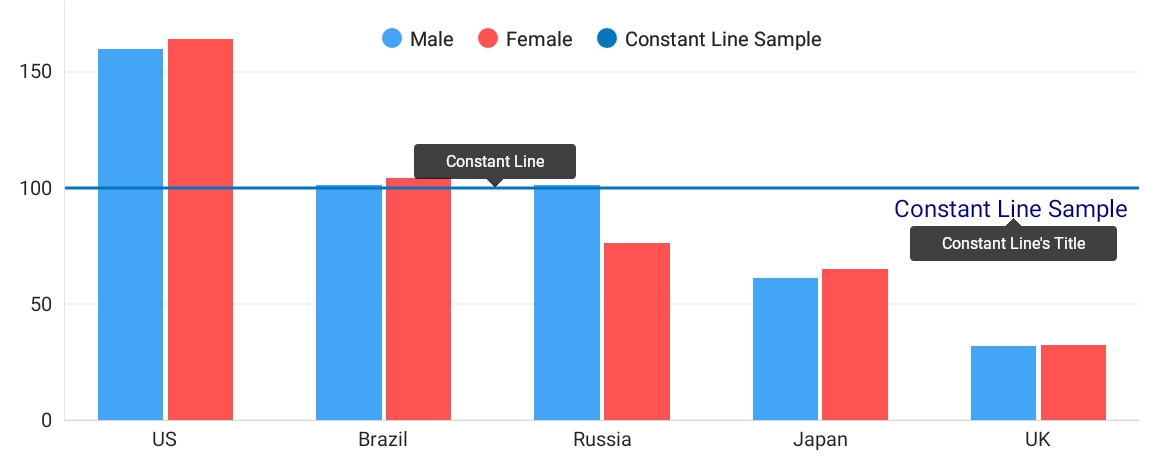
<dxc:ChartView>
  <dxc:ChartView.AxisY>
      <dxc:NumericAxisY>
          <dxc:NumericAxisY.ConstantLines>
              <dxc:NumericConstantLine AxisValue="100" ShowBehind="False"
                                       VisibleInLegend="True" LegendText="Constant Line Sample">
                  <!-- Customize the constant line title. -->
                  <dxc:NumericConstantLine.Title>
                      <dxc:ConstantLineTitle Text="Constant Line Sample" ShowBelowLine="True" Alignment="Far">
                          <dxc:ConstantLineTitle.Style>
                              <dxc:TitleStyle>
                                  <dxc:TitleStyle.TextStyle>
                                      <dxc:TextStyle Color="DarkBlue" Size="24"/>
                                  </dxc:TitleStyle.TextStyle>
                              </dxc:TitleStyle>
                          </dxc:ConstantLineTitle.Style>
                      </dxc:ConstantLineTitle>
                  </dxc:NumericConstantLine.Title>
                  <!-- Customize the constant line appearance. -->
                  <dxc:NumericConstantLine.Style>
                      <dxc:ConstantLineStyle Thickness="3"/>
                  </dxc:NumericConstantLine.Style>
              </dxc:NumericConstantLine>
          </dxc:NumericAxisY.ConstantLines>
      </dxc:NumericAxisY>
  </dxc:ChartView.AxisY>
</dxc:ChartView>
Strips
You can use strips to highlight a range limited by two fixed values (minimal and maximal limits) and trace whether the series point values fall in or out of that range. To do this, create a NumericStrip object, specify its MinLimit and MaxLimit values and add this strip object to the NumericAxisY.Strips collection.
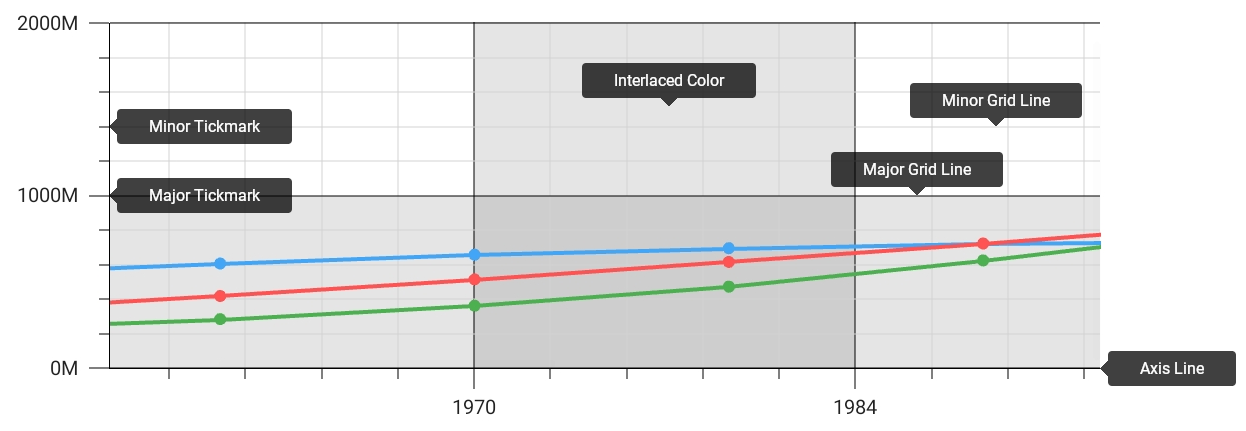
Grid Lines, Tickmarks and Interlacing
To improve the readability of a chart’s visual data, you can customize the y-axis appearance. To do this, create an AxisStyle object, specify its properties’ values, and assign this object to the axis’s NumericAxisY.Style property.
This example demonstrates how to use the AxisStyle class properties to customize axis lines, display grid lines and tickmarks with the specified appearance, and enable interlaced color intervals on the chart diagram.
<ContentPage xmlns="http://xamarin.com/schemas/2014/forms"
             xmlns:x="http://schemas.microsoft.com/winfx/2009/xaml"
             x:Class="ChartAxesExample.MainPage"
             xmlns:dxc="clr-namespace:DevExpress.XamarinForms.Charts;assembly=DevExpress.XamarinForms.Charts">
  <ContentPage.Resources>
    <dxc:AxisStyle x:Key="axisStyle"
                   LineThickness="1" LineColor="Black"
                   MajorGridlinesVisible="True" MajorGridlinesThickness="1" MajorGridlinesColor="Black"
                   MinorGridLinesVisible="True" MinorGridlinesThickness="1" MinorGridlinesColor="LightGray"
                   MajorTickmarksVisible="True" MajorTickmarksThickness="1" MajorTickmarksLength="15"
                   MinorTickmarksVisible="True" MinorTickmarksThickness="1" MinorTickmarksLength="10"
                   InterlacedVisible="True" />
  </ContentPage.Resources>
  <dxc:ChartView>
    <!--...-->
    <dxc:ChartView.AxisX>
        <dxc:DateTimeAxisX Style="{StaticResource axisStyle}" />
    </dxc:ChartView.AxisX>
    <dxc:ChartView.AxisY>
        <dxc:NumericAxisY Style="{StaticResource axisStyle}"/>
    </dxc:ChartView.AxisY>
  </dxc:ChartView>
</ContentPage>
Axis Position
Use the Position property to specify whether a y-axis should be located on the left or on the right of the chart diagram.
<dxc:ChartView.AxisY>
  <dxc:NumericAxisY Position="Far">
      <!-- Other axis settings. -->
  </dxc:NumericAxisY >
</dxc:ChartView.AxisY>