DateTimeAxisX Class
The X-axis the chart uses to display series that represent data sources with date-time arguments (when theIXYSeriesData.GetDataType‘s implementation returns DateTime, WeightedDateTime, and Financial).
Namespace: DevExpress.XamarinForms.Charts
Assembly: DevExpress.XamarinForms.Charts.dll
Declaration
public class DateTimeAxisX :
    AxisX
Remarks
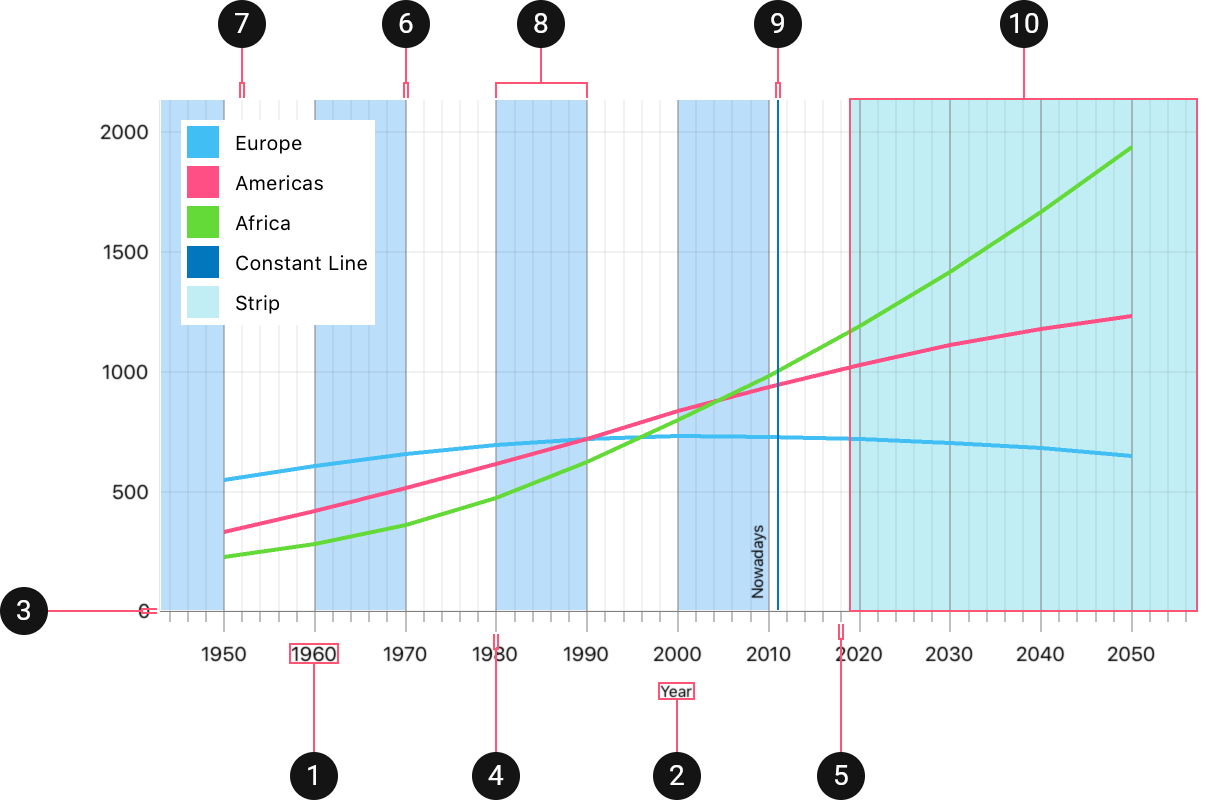
The following image highlights elements the axis includes:
How to: Specify chart axes
The ChartView.AxisX property contains the X-axis the chart uses to arrange series:
<dxc:ChartView>
    <dxc:ChartView.AxisX>
        <dxc:DateTimeAxisX>
    </dxc:ChartView.AxisX>
</dxc:ChartView>
Note
The chart creates axes compatible with the first series’ data type if the chart does not have specified axes.
How to: Manage the Value Range the Axis Display
The X-axis automatically calculates the value range by data of all series that the axis measures. To show a particular value interval, specify the range’s VisualMin and VisualMax properties:
<dxc:DateTimeAxisX>
    <dxc:DateTimeAxisX.Range>
        <dxc:DateTimeRange VisualMin="1/1/1960" VisualMax="1/1/2040">
    </dxc:DateTimeAxisX.Range>
</dxc:DateTimeAxisX>
Note
Chart zooming and scrolling change visual values. To limit the interval in which users can change a visual range, use DateTimeRange.Min and DateTimeRange.Max properties.
The following table lists all classes and properties the code above uses:
Symbol | Description |
|---|---|
| |
| |
| |
| |
| |
|
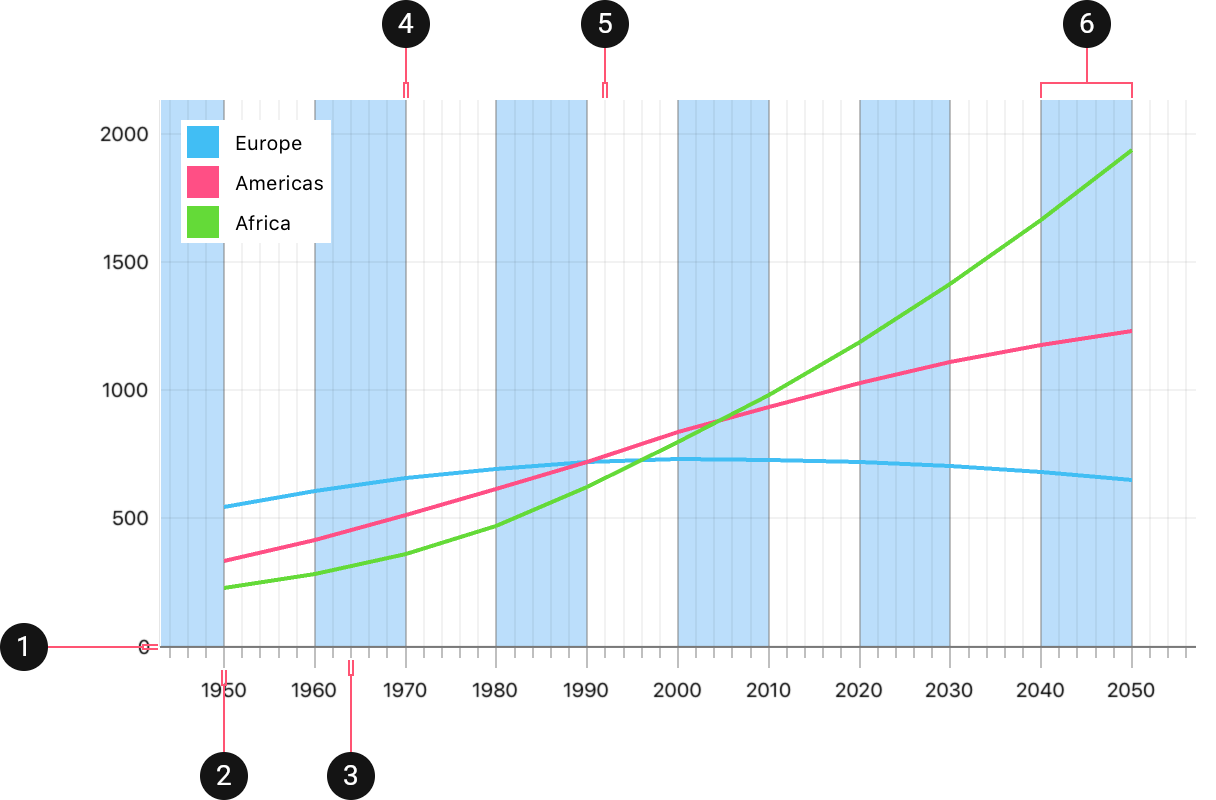
How to: Customize X-Axis Scale Parameters
The X-Axis provides settings that manage how the axis lays out its grid lines, tick marks, and labels. The image below demonstrates these settings:
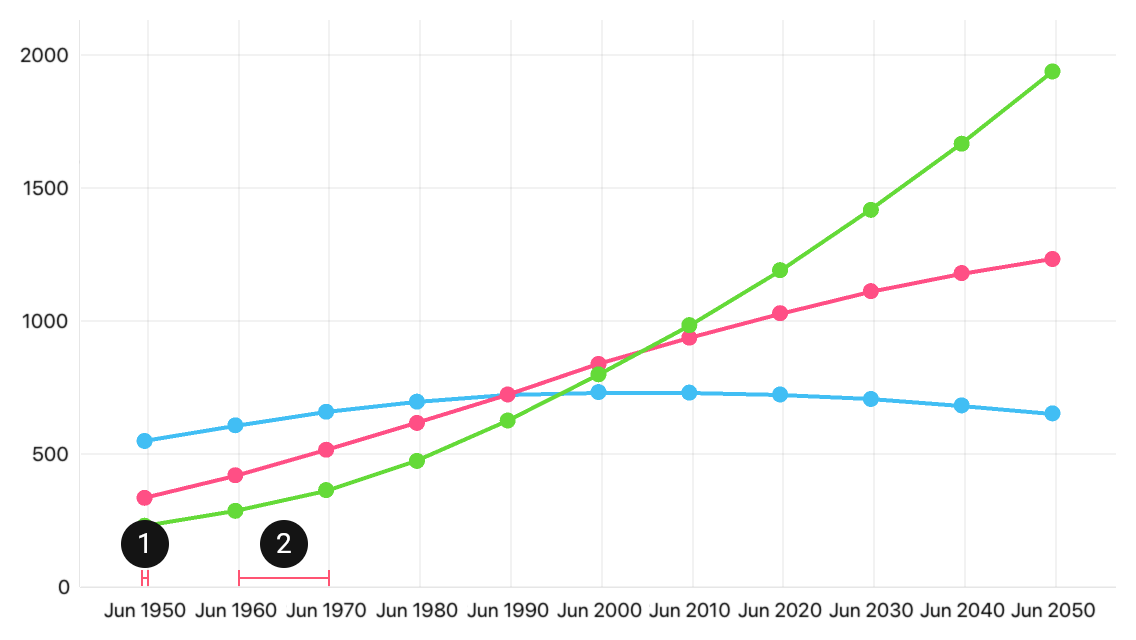
- GridOffset - The distance between the first tick mark/grid line and the minimum value of the axis value range, in MeasureUnits.
- GridSpacing - The number of GridAlignment units between neighbor major tick marks and grid lines.
The following code customizes these parameters:
<dxc:DateTimeAxisX MeasureUnit="Month" GridOffset="6"
                   GridAlignment="Year" Grid Spacing="10"/>
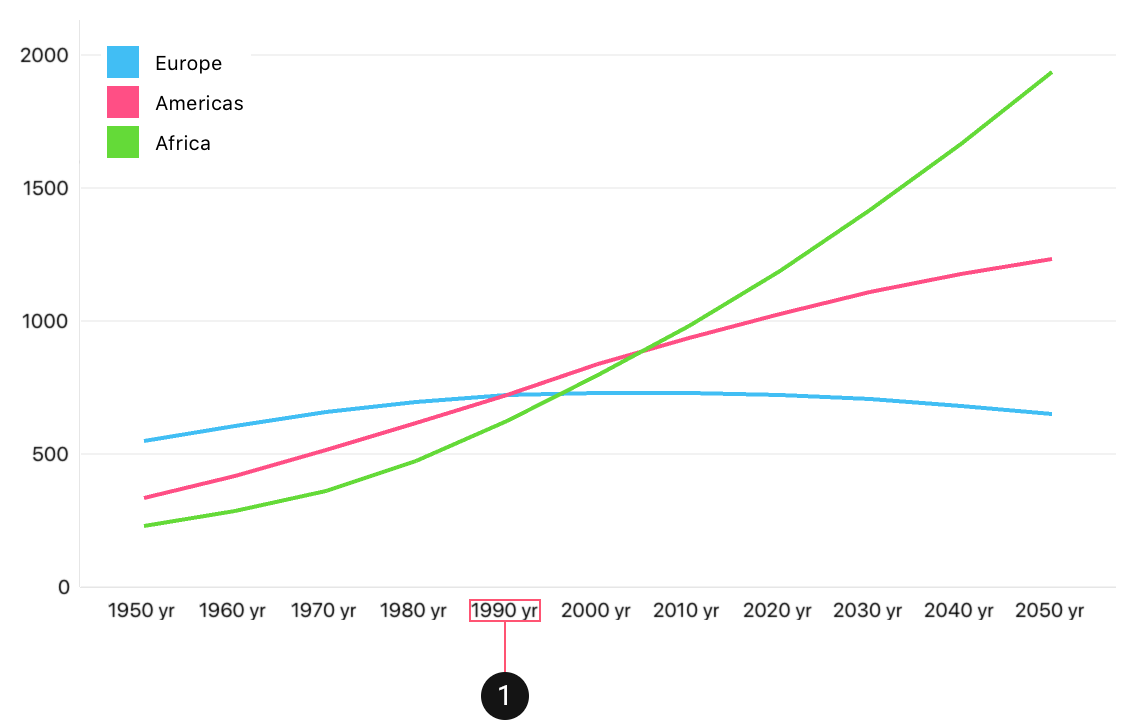
How to: Manage Axis Labels
Axis Labels show the textual representation of axis values at which the axis places major tick marks and grid lines:
The code snippet below demonstrates how to customize axis labels:
<dxc:DateTimeAxisX>
    <dxc:DateTimeAxisX.Label>
        <dxc:AxisLabel TextFormat="yyyy yr">
    <dxc:DateTimeAxisX.Label>
</dxc:DateTimeAxisX>
The code above uses the following class and property:
Symbol | Description |
|---|---|
Provides access to the settings that specify the text format, position, and appearance of axis labels. | |
Stores axis label settings. |
How to: Specify the Axis Title
The Axis Title is additional text that explains the values the axis measures:
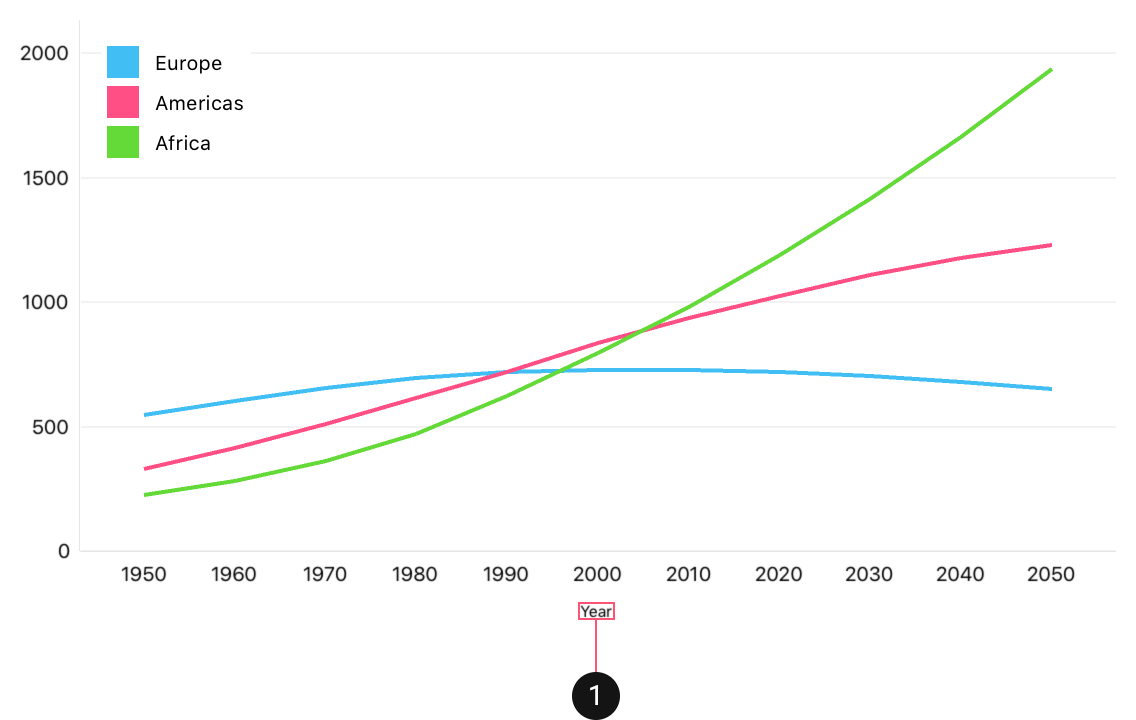
The markup below enables the title that the image above shows:
<dxc:DateTimeAxisX>
    <dxc:DateTimeAxisX.Title>
        <dxc:AxisTitle Text="Year">
    <dxc:DateTimeAxisX.Title>
</dxc:DateTimeAxisX>
The following table lists API that the markup above uses:
Symbol | Description |
|---|---|
Specifies the axis title. | |
Stores axis title settings. |
How to: Add a Constant Line
A Constant Line highlights a specific axis value by a perpendicular straight line with a title:
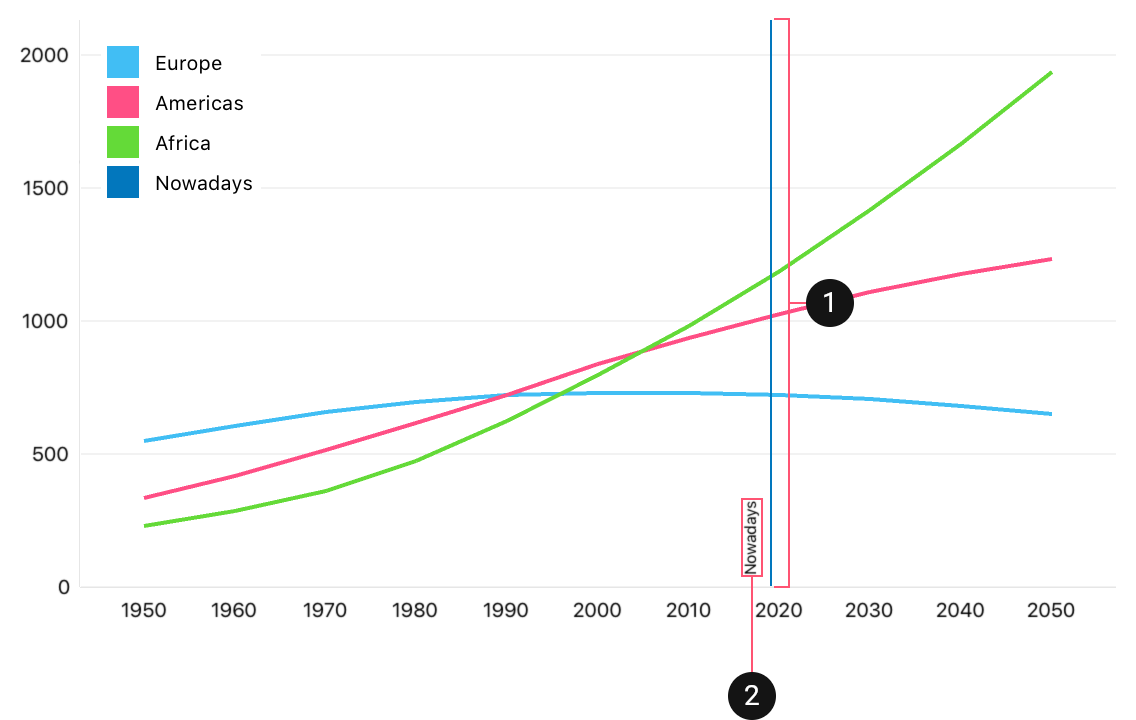
The following code adds the constant line to the X-axis:
<dxc:DateTimeAxisX>
    <dxc:DateTimeAxisX.ConstantLines>
        <dxc:DateTimeConstantLine AxisValue="2019" LegendText="Nowadays">
            <dxc:DateTimeConstantLine.Title>
                <dxc:ConstantLineTitle Text="Nowadays">
            </dxc:DateTimeConstantLine.Title>
        </dxc:DateTimeConstantLine>
    <dxc:DateTimeAxisX.ConstantLines>
</dxc:DateTimeAxisX>
The code above used the following classes and properties:
Symbol | Description |
|---|---|
| |
The vertical straight line that passes through the chart and indicates a date-time x-axis’s value. | |
Gets or sets the constant line position along the axis. | |
Gets or sets the text that identifies the constant line in the chart legend. | |
Gets or sets settings of the constant line title. | |
Stores constant line title settings. | |
Gets or sets the text the title displays. |
How to: Add a Strip
A Strip highlights a specific range of axis values using a perpendicular straight area with an axis label:
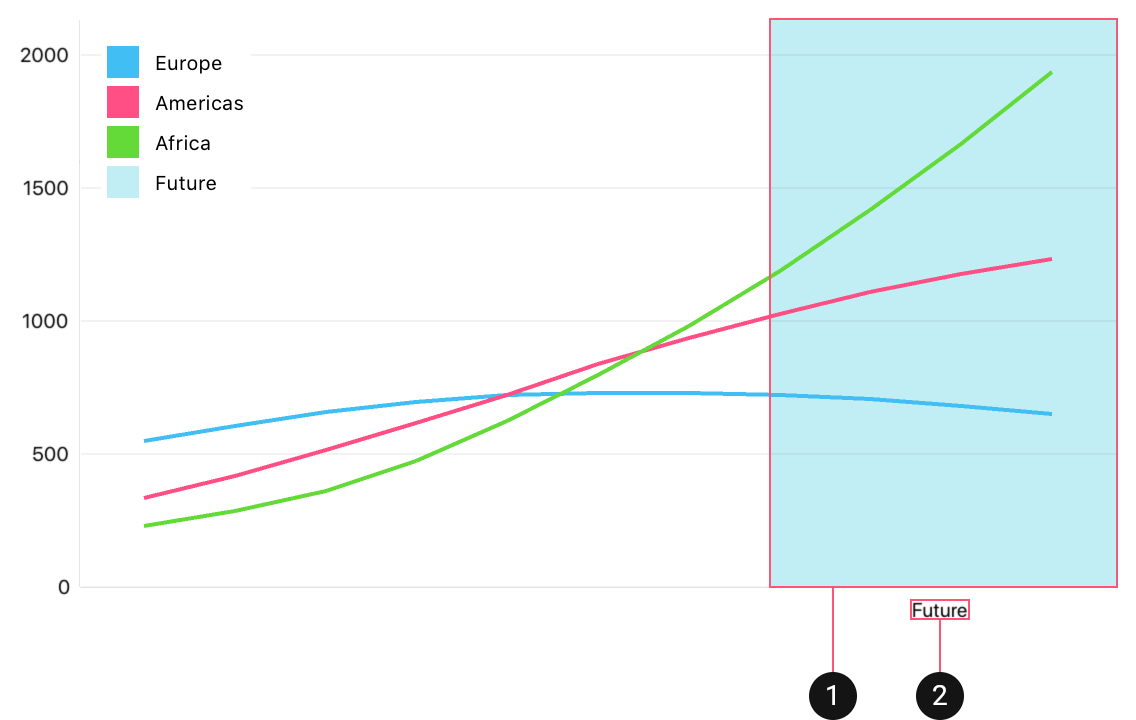
Note
The axis hides its labels when any strip has a label.
The following code adds the strip to the X-axis:
<dxc:DateTimeAxisX>
    <dxc:DateTimeAxisX.Strips>
        <dxc:DateTimeStrip MinLimit="2019" MaxLimitEnabled="False">
            <dxc:DateTimeStrip.AxisLabel>
                <dxc:StripAxisLabel Text="Future">
            </dxc:DateTimeStrip.AxisLabel>
        </dxc:DateTimeStrip>
    <dxc:DateTimeAxisX.Strips>
</dxc:DateTimeAxisX>
The code above used the following classes and properties:
Symbol | Description |
|---|---|
| |
The highlighted area limited by two fixed values (minimal and maximal limits) of an axis, and is perpendicular to the axis. | |
Gets or sets the minimum limiting value of the strip along an axis. | |
Indicates whether the strip is limited by its MinLimit value. | |
Gets or sets the maximum limiting value of the strip along an axis. | |
Indicates whether the strip is limited by its MaxLimit value. | |
Gets or sets a text the strip provides to the chart legend. | |
Gets or sets the axis label the strip displays on the axis to which the strip belongs. | |
| |
|
How to: Customize Axis Appearance
The axis provides the Style property that stores the appearance of the following elements:
Element | Properties That Affect the Element | |
|---|---|---|
1. | Axis Line | |
2. | Major Tick Marks | LineColor, MajorTickmarksThickness, MajorTickmarksLength, MajorTickmarksVisible |
3. | Minor Tick Marks | LineColor, MinorTickmarksThickness, MinorTickmarksLength, MinorTickmarksVisible |
2. | Major Grid Lines | MajorGridlinesThickness, MajorGridlinesColor, MajorGridlinesVisible |
3. | Minor Grid Lines | MinorGridlinesThickness, MinorGridlinesColor, MinorGridLinesVisible |
Note
Labels, Titles, Constant Lines and Strips provide their Style properties that manage the appearance of these elements.