Colorize Series Points
- 11 minutes to read
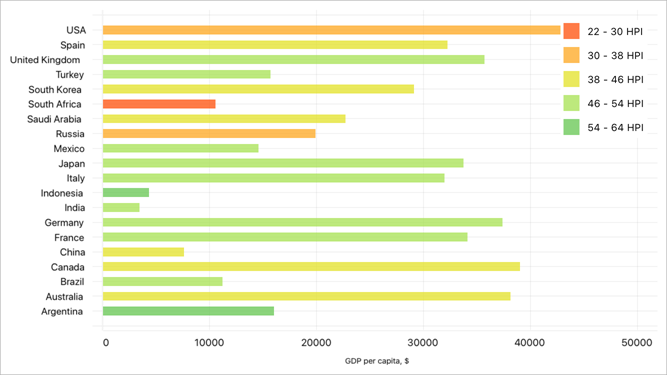
A series point colorizer helps you color-code series points to enhance data visualization. Use a series point colorizer to specify one or more conditions based on which a chart applies colors to series points. For example, point colors indicate the Happy Planet Index (HPI for short) on the following chart:
You can use a predefined colorizer or implement a custom colorizer for series points.
Use Predefined Colorizers
ChartView ships with point and value range colorizers that use predefined algorithms to select point colors.
Point Colorizers
A predefined point colorizer uses colors from the default or custom palette to paint series points on a chart. Colors apply in the same order they appear in the palette.
To enable a point colorizer for a series, assign a ColorEachPointColorizer object to the series’s PointColorizer property.
-
The assigned colorizer applies 7 default colors to points in turn if you don’t specify a palette (ColorEachPointColorizer.Palette) explicitly.
<dxc:PointSeries> <!-- Series Data --> <dxc:PointSeries.PointColorizer> <dxc:ColorEachPointColorizer/> </dxc:PointSeries.PointColorizer> </dxc:PointSeries> -
Use the ColorEachPointColorizer.Palette property to specify custom colors for series points.
<dxc:PointSeries>
    <!-- Series Data -->
    <dxc:PointSeries.PointColorizer>
        <dxc:ColorEachPointColorizer>
            <dxc:ColorEachPointColorizer.Palette>
                <x:Array Type="{x:Type Color}">
                    <Color>#006EC6</Color>
                    <Color>#18ce9a</Color>
                    <Color>#009ad6</Color>
                    <Color>#79cb5d</Color>
                    <Color>#0ed2dc</Color>
                    <Color>#71a9dd</Color>
                    <Color>#447238</Color>
                    <Color>#12898e</Color>
                </x:Array>
            </dxc:ColorEachPointColorizer.Palette>
        </dxc:ColorEachPointColorizer>
    </dxc:PointSeries.PointColorizer>
</dxc:PointSeries>
Value Range Colorizers
You can color series points based on their Y-axis values. To do this, use a value range colorizer:
- Assign a colorizer object to the series’s PointColorizer property.
- Populate the colorizer’s ColorStops collection with ColorStop objects. Each ColorStop object defines a value range (a pair of Y-axis values) and color. If a Y-axis value falls within the range, the point is painted with this color.
The following table lists series types and value range colorizers they support:
Series Type | Value Range Colorizer | |
|---|---|---|
Area, RangeArea, Point, Bar, Line, | ||
Example
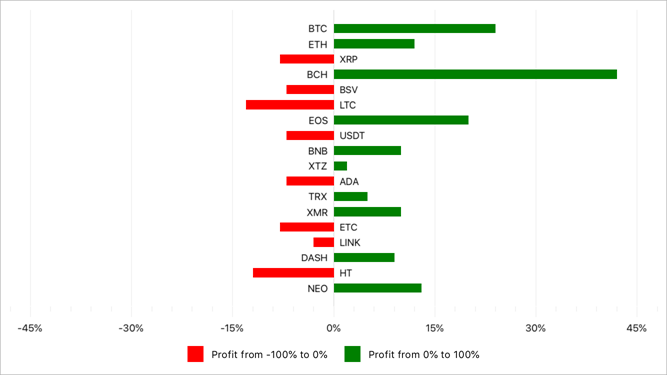
In this example, the bar chart displays cryptocurrency portfolio yield. It colors series points red when their Y-axis values are between -100 and 0, and green when values are between 0 and 100. Note that this chart diagram is rotated.
Create a data source - a list of objects each of which has the Ticker property that returns a string (point argument) and the Profit property that returns a number (point value).
using System.Collections.Generic;
using DevExpress.XamarinForms.Charts;
using Xamarin.Forms;

namespace ColorizerExample {
    public class ViewModel {
        public List<CryptocurrencyPortfolioItem> CryptocurrencyPortfolioData { get; }

        public ViewModel(){
            CryptocurrencyPortfolioData = new List<CryptocurrencyPortfolioItem>(){
                new CryptocurrencyPortfolioItem("NEO", 13),
                new CryptocurrencyPortfolioItem("HT", -12),
                new CryptocurrencyPortfolioItem("DASH", 9),
                new CryptocurrencyPortfolioItem("LINK", -3),
                new CryptocurrencyPortfolioItem("ETC", -8),
                new CryptocurrencyPortfolioItem("XMR", 10),
                new CryptocurrencyPortfolioItem("TRX", 5),
                new CryptocurrencyPortfolioItem("ADA", -7),
                new CryptocurrencyPortfolioItem("XTZ", 2),
                new CryptocurrencyPortfolioItem("BNB", 10),
                new CryptocurrencyPortfolioItem("USDT", -7),
                new CryptocurrencyPortfolioItem("EOS", 20),
                new CryptocurrencyPortfolioItem("LTC", -13),
                new CryptocurrencyPortfolioItem("BSV", -7),
                new CryptocurrencyPortfolioItem("BCH", 42),
                new CryptocurrencyPortfolioItem("XRP", -8),
                new CryptocurrencyPortfolioItem("ETH", 12),
                new CryptocurrencyPortfolioItem("BTC", 24),
            };
        }
    }

    public class CryptocurrencyPortfolioItem {
        public string Ticker { get; private set; }
        public double Profit { get; private set; }

        public CryptocurrencyPortfolioItem(string ticker, double profit) {
            Ticker = ticker;
            Profit = profit;
        }
    }
}
Assign a ValueBandPointColorizer object to the BarSeries.PointColorizer property. Populate the colorizer’s ColorStops collection with two ColorStop objects that specify colors for ranges of point values.
<ContentPage xmlns:x="http://schemas.microsoft.com/winfx/2009/xaml"
             xmlns:dxc="http://schemas.devexpress.com/xamarin/2014/forms/charts"
             x:Class="ColorizerExample.MainPage"
             xmlns:local="clr-namespace:ColorizerExample">
    <ContentPage.BindingContext>
        <local:ViewModel/>
    </ContentPage.BindingContext>
    <dxc:ChartView x:Name="chart" Rotated="True">
        <dxc:ChartView.Series>
            <dxc:BarSeries LegendTextPattern="{}Profit from {CLV}% to {CHV}%">
                <!-- Bind the series to the data source. -->
                <dxc:BarSeries.Data>
                    <dxc:SeriesDataAdapter
                            DataSource="{Binding CryptocurrencyPortfolioData}"
                            ArgumentDataMember="Ticker">
                        <dxc:ValueDataMember Type="Value" Member="Profit"/>
                    </dxc:SeriesDataAdapter>
                </dxc:BarSeries.Data>

                <dxc:BarSeries.Label>
                    <dxc:BarSeriesLabel Position="Outside"
                                        Behavior="Cut"
                                        TextPattern="{}{V}%"/>
                </dxc:BarSeries.Label>

                <dxc:BarSeries.PointColorizer>
                    <dxc:ValueBandPointColorizer>
                        <dxc:ValueBandPointColorizer.ColorStops>
                            <dxc:ColorStop Color="Green" Value1="0" Value2="100"/>
                            <dxc:ColorStop Color="Red" Value1="0" Value2="-100"/>
                        </dxc:ValueBandPointColorizer.ColorStops>
                    </dxc:ValueBandPointColorizer>
                </dxc:BarSeries.PointColorizer>
            </dxc:BarSeries>
        </dxc:ChartView.Series>

        <!-- Specify axis and legend settings here. -->
    </dxc:ChartView>
</ContentPage>
Implement Custom Colorizers
You can also implement custom colorizers to paint series points.
Point Colorizers
The ChartView can color points of a series according to a custom algorithm based on point arguments/values and values of the chart’s bound data source.
Create a class that implements a custom colorizer interface and assign this class instance to the series’s PointColorizer property. The following table lists custom colorizer interfaces that ChartView series support:
Series Type | Colorizer Interface | Colorizer Description | |
|---|---|---|---|
The GetColor method’s parameter (ColoredPointInfo) allows you to obtain the following information about a series point and use it to create a color rule:
| |||
All series, except for financial and pie series | The GetColor method’s parameter is an index of the data source’s item that corresponds to the series point. If data aggregation is enabled, only the index of the first point’s item is passed. |
Color Points by Their Arguments
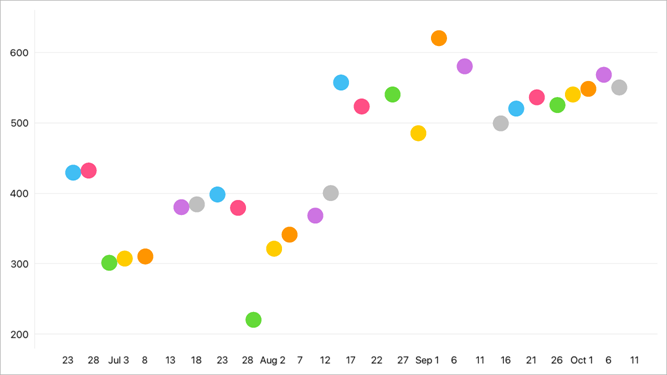
In this example, the bar chart displays monthly values colored based on the season.
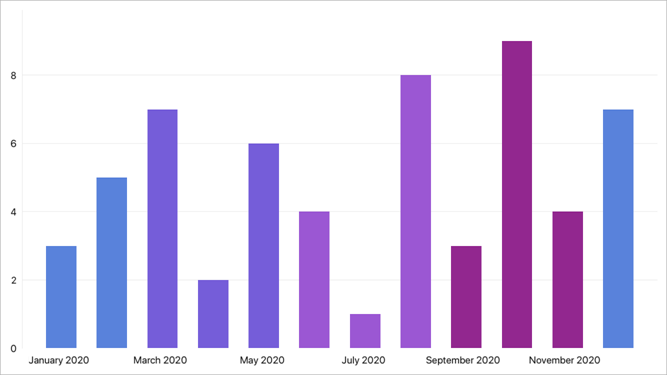
- Create a data source - a list of objects that define data points with date-time arguments and numeric values.
Create a colorizer class (CustomColorizer, in this example) that implements the ICustomPointColorizer interface.
Implement the GetColor method to return a data point’s color based on a ColoredPointInfo object passed as the method’s parameter. Use the ColoredPointInfo.DateTimeArgument property to obtain the data point’s argument value.using System; using Xamarin.Forms; using System.Collections.Generic; using DevExpress.XamarinForms.Charts; namespace ColorizerExample { public class ViewModel { public List<DataItem> Data { get; } public ViewModel() { Data = new List<DataItem>() { new DataItem() { Argument = new DateTime(2020, 1, 1), Value = 3 }, new DataItem() { Argument = new DateTime(2020, 2, 1), Value = 5 }, new DataItem() { Argument = new DateTime(2020, 3, 1), Value = 7 }, new DataItem() { Argument = new DateTime(2020, 4, 1), Value = 2 }, new DataItem() { Argument = new DateTime(2020, 5, 1), Value = 6 }, new DataItem() { Argument = new DateTime(2020, 6, 1), Value = 4 }, new DataItem() { Argument = new DateTime(2020, 7, 1), Value = 1 }, new DataItem() { Argument = new DateTime(2020, 8, 1), Value = 8 }, new DataItem() { Argument = new DateTime(2020, 9, 1), Value = 3 }, new DataItem() { Argument = new DateTime(2020, 10, 1), Value = 9 }, new DataItem() { Argument = new DateTime(2020, 11, 1), Value = 4 }, new DataItem() { Argument = new DateTime(2020, 12, 1), Value = 7 }, }; } } public class DataItem { public DateTime Argument { get; set; } public double Value { get; set; } } public class CustomColorizer : ICustomPointColorizer { Color ICustomPointColorizer.GetColor(ColoredPointInfo info) { switch (info.DateTimeArgument.Month) { case 12: case 1: case 2: return Color.FromHex("#5982db"); case 3: case 4: case 5: return Color.FromHex("#755dd9"); case 6: case 7: case 8: return Color.FromHex("#9b57d3"); case 9: case 10: case 11: return Color.FromHex("#92278f"); default: return Color.Default; } } public ILegendItemProvider GetLegendItemProvider() { return null; } } }Assign a CustomColorizer object to the BarSeries.PointColorizer property.
<ContentPage
    xmlns:x="http://schemas.microsoft.com/winfx/2009/xaml"
    xmlns:dxc="http://schemas.devexpress.com/xamarin/2014/forms/charts"
    xmlns:local="clr-namespace:ColorizerExample"
    x:Class="ColorizerExample.MainPage">
    <ContentPage.BindingContext>
        <local:ViewModel />
    </ContentPage.BindingContext>
    <dxc:ChartView>
        <dxc:ChartView.Series>
            <dxc:BarSeries PointColorizer="{local:CustomColorizer}">
                <!-- Bind the series to the data source. -->
                <dxc:BarSeries.Data>
                    <dxc:SeriesDataAdapter DataSource="{Binding Data}"
                                           ArgumentDataMember="Argument">
                        <dxc:ValueDataMember Member="Value" Type="Value" />
                    </dxc:SeriesDataAdapter>
                </dxc:BarSeries.Data>
            </dxc:BarSeries>
        </dxc:ChartView.Series>
        <dxc:ChartView.AxisX>
            <dxc:DateTimeAxisX MeasureUnit="Month" />
        </dxc:ChartView.AxisX>
    </dxc:ChartView>
</ContentPage>
Color Points by Data Source Values
In this example, the bar chart visualizes GDP values for the G20 and colors data points according to which part of the world the country belongs.
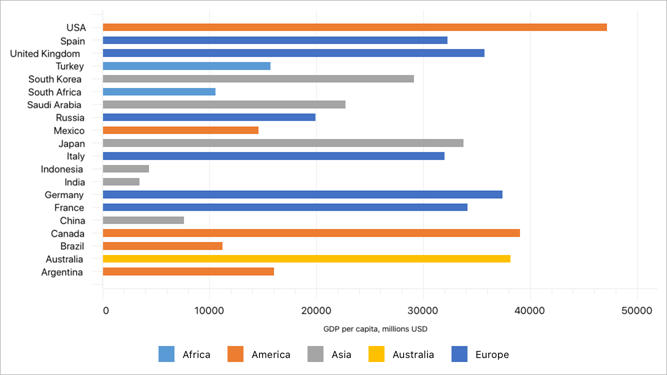
- Create a data source - a list of objects each of which stores a country’s name, GDP value, and the part of the world (region) where the country is located.
Create a class (ColorizerByRegion, in this example) that implements the IIndexBasedCustomPointColorizer interface. Specify a color for each region and implement the IIndexBasedCustomPointColorizer.GetColor method that returns a color for each data point depending on the Region data member’s value.
This class should also implement the IIndexBasedCustomPointColorizer.GetLegendItemProvider method and the ILegendItemProvider interface to specify legend items that show region colors.using System.Collections.Generic; using DevExpress.XamarinForms.Charts; using Xamarin.Forms; namespace ColorizerExample { public class ViewModel { CountryStatisticsData data = new CountryStatisticsData(); public List<CountryStatistics> CountryStatisticsData => this.data.SeriesData; } public class CountryStatisticsData { readonly List<CountryStatistics> data = new List<CountryStatistics> { new CountryStatistics("Argentina", 16011.6728032264, "America"), new CountryStatistics("Australia", 38159.6336533223, "Australia"), new CountryStatistics("Brazil", 11210.3908053823, "America"), new CountryStatistics("Canada", 39050.1673163719, "America"), new CountryStatistics("China", 7599, "Asia"), new CountryStatistics("France", 34123.1966249035, "Europe"), new CountryStatistics("Germany", 37402.2677660974, "Europe"), new CountryStatistics("India", 3425.4489267524, "Asia"), new CountryStatistics("Indonesia", 4325.2533282173, "Asia"), new CountryStatistics("Italy", 31954.1751781228, "Europe"), new CountryStatistics("Japan", 33732.8682226596, "Asia"), new CountryStatistics("Mexico", 14563.884253986, "America"), new CountryStatistics("Russia", 19891.3528339013, "Europe"), new CountryStatistics("Saudi Arabia", 22713.4852913284, "Asia"), new CountryStatistics("South Africa", 10565.1840563081, "Africa"), new CountryStatistics("South Korea", 29101.0711400706, "Asia"), new CountryStatistics("Turkey", 15686.860167575, "Africa"), new CountryStatistics("United Kingdom", 35686.1997705521, "Europe"), new CountryStatistics("Spain", 32230.3585974199, "Europe"), new CountryStatistics("USA", 47153.0094273427, "America"), }; public List<CountryStatistics> SeriesData => this.data; } public class CountryStatistics { public string Country { get; private set; } public double Gdp { get; private set; } public string Region { get; private set; } public CountryStatistics(string country, double gdp, string region) { Country = country; Gdp = gdp; Region = region; } } public class ColorizerByRegion : IIndexBasedCustomPointColorizer, ILegendItemProvider { private CountryStatisticsData data = new CountryStatisticsData(); private Dictionary<string, Color> colors = new Dictionary<string, Color> { {"Africa", Color.FromHex("5b9bd5")}, {"America", Color.FromHex("ed7d31")}, {"Asia", Color.FromHex("a5a5a5")}, {"Australia", Color.FromHex("ffc000")}, {"Europe", Color.FromHex("4472c4")} }; private List<string> regions = new List<string> { "Africa", "America", "Asia", "Australia", "Europe" }; public Color GetColor(int index) { return colors[data.SeriesData[index].Region]; } public CustomLegendItem GetLegendItem(int index) { return new CustomLegendItem(regions[index], colors[regions[index]]); } public int GetLegendItemCount() { return regions.Count; } public ILegendItemProvider GetLegendItemProvider() { return this; } } }Assign a ColorizerByRegion object to the BarSeries.PointColorizer property.
<ContentPage
    xmlns:x="http://schemas.microsoft.com/winfx/2009/xaml"
    xmlns:dxc="http://schemas.devexpress.com/xamarin/2014/forms/charts"
    x:Class="ColorizerExample.MainPage"
    xmlns:local="clr-namespace:ColorizerExample">
    <ContentPage.BindingContext>
        <local:ViewModel/>
    </ContentPage.BindingContext>
    <dxc:ChartView Rotated="True">
        <dxc:ChartView.Series>
            <dxc:BarSeries PointColorizer="{local:ColorizerByRegion}">
                <!-- Bind the series to the data source. -->
                <dxc:BarSeries.Data>
                    <dxc:SeriesDataAdapter DataSource="{Binding CountryStatisticsData}"
                                           ArgumentDataMember="Country">
                        <dxc:ValueDataMember Type="Value" Member="Gdp"/>
                    </dxc:SeriesDataAdapter>
                </dxc:BarSeries.Data>
            </dxc:BarSeries>
        </dxc:ChartView.Series>

        <!-- Specify axis and legend settings here. -->
    </dxc:ChartView>
</ContentPage>
Value Range Colorizers
A predefined value range colorizer colors points according to their Y-axis values. If you need a series point’s color to indicate a value of the specified data source field, implement a custom value range colorizer. To do this:
- Assign a CustomValueBandPointColorizer object to the series’s PointColorizer property.
- Create a class implementing the ICustomColorizerNumericValueProvider interface and its GetValueForColorizer method that returns a value from the data source based on which a series point should be colored. Assign this class value to the colorizer’s ValueProvider property.
- Populate the colorizer’s ColorStops collection with ColorStop objects. Each ColorStop object defines a value range and color. If a value that the GetValueForColorizer method returns for a series point falls within the range, the point is painted with this color.
You can use a custom value range colorizer for any series except for financial and pie series.
Example
In this example, the bubble chart displays GDP values for the G20. A point’s size indicates the country population and the color indicates the HPI.
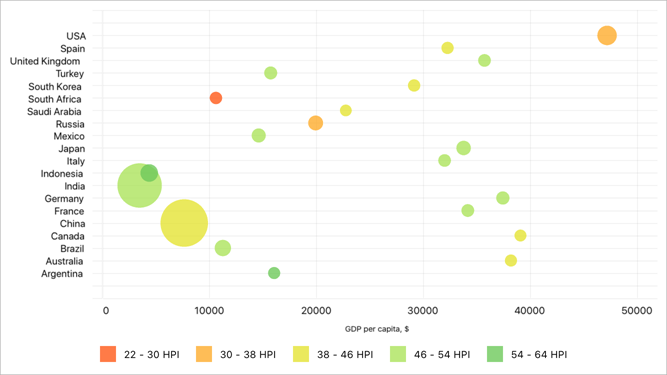
- Create a data source - a list of objects each of which stores a country’s name, GDP value, population, and HPI.
Create a class (HpiProvider, in this example) that implements the ICustomColorizerNumericValueProvider interface and the GetValueForColorizer method, which returns the Hpi value for a series point.
using System.Collections.Generic;
using DevExpress.XamarinForms.Charts;

namespace ColorizerExample {
    public class ViewModel {
        HpiProvider valueProvider = new HpiProvider();
        public List<CountryStatistics> CountryStatisticsData => this.valueProvider.SeriesData;
    }

    public class HpiProvider : ICustomColorizerNumericValueProvider {
        private CountryStatisticsData data = new CountryStatisticsData();

        public double GetValueForColorizer(int index) {
            return this.data.SeriesData[index].Hpi;
        }

        public List<CountryStatistics> SeriesData => this.data.SeriesData;
    }

    public class CountryStatisticsData {
        readonly List<CountryStatistics> data = new List<CountryStatistics> {
            new CountryStatistics("Argentina", 16011.6728032264, 40412000, 54.055),
            new CountryStatistics("Australia", 38159.6336533223, 40412000, 41.980),
            new CountryStatistics("Brazil", 11210.3908053823, 194946000, 52.9),
            new CountryStatistics("Canada", 39050.1673163719, 34126000, 43.56),
            new CountryStatistics("China", 7599, 1338300000, 44.66),
            new CountryStatistics("France", 34123.1966249035, 64895000, 46.523),
            new CountryStatistics("Germany", 37402.2677660974, 81777000, 47.2),
            new CountryStatistics("India", 3425.4489267524, 1224615000, 50.865),
            new CountryStatistics("Indonesia", 4325.2533282173, 239870000, 55.481),
            new CountryStatistics("Italy", 31954.1751781228, 60483000, 46.352),
            new CountryStatistics("Japan", 33732.8682226596, 127451000, 47.508),
            new CountryStatistics("Mexico", 14563.884253986, 113423000, 52.894),
            new CountryStatistics("Russia", 19891.3528339013, 141750000, 34.518),
            new CountryStatistics("Saudi Arabia", 22713.4852913284, 27448000, 45.965),
            new CountryStatistics("South Africa", 10565.1840563081, 49991000, 28.190),
            new CountryStatistics("South Korea", 29101.0711400706, 48875000, 43.781),
            new CountryStatistics("Turkey", 15686.860167575, 72752000, 47.623),
            new CountryStatistics("United Kingdom", 35686.1997705521, 62232000, 47.925),
            new CountryStatistics("Spain", 32230.3585974199, 46071000, 44.063),
            new CountryStatistics("USA", 47153.0094273427, 309349000, 37.340),
        };
        public List<CountryStatistics> SeriesData => this.data;
    }

    public class CountryStatistics {
        public string Country { get; private set; }
        public double Gdp { get; private set; }
        public double Population { get; private set; }
        public double Hpi { get; private set; }

        public CountryStatistics(string country, double gdp, double population, double hpi) {
            Country = country;
            Gdp = gdp;
            Population = population;
            Hpi = hpi;
        }
    }
}
Set the BubbleSeries.PointColorizer property to a CustomValueBandPointColorizer object and assign an HpiProvider object to the CustomValueBandPointColorizer.ValueProvider property.
Populate the colorizer’s ColorStops collection to specify colors for ranges of HPI values.
<ContentPage
    xmlns:x="http://schemas.microsoft.com/winfx/2009/xaml"
    xmlns:dxc="http://schemas.devexpress.com/xamarin/2014/forms/charts"
    x:Class="ColorizerExample.MainPage"
    xmlns:local="clr-namespace:ColorizerExample">
    <ContentPage.BindingContext>
        <local:ViewModel/>
    </ContentPage.BindingContext>
    <dxc:ChartView Rotated="True">
        <dxc:ChartView.Series>
            <dxc:BubbleSeries LegendTextPattern="{}{CLV} - {CHV} HPI">
                <!-- Bind the series to the data source. -->
                <dxc:BubbleSeries.Data>
                    <dxc:SeriesDataAdapter DataSource="{Binding CountryStatisticsData}"
                                           ArgumentDataMember="Country">
                        <dxc:ValueDataMember Type="Value" Member="Gdp"/>
                        <dxc:ValueDataMember Type="Weight" Member="Population"/>
                    </dxc:SeriesDataAdapter>
                </dxc:BubbleSeries.Data>

                <dxc:BubbleSeries.PointColorizer>
                    <dxc:CustomValueBandPointColorizer
                        ValueProvider="{local:HpiProvider}">
                        <dxc:CustomValueBandPointColorizer.ColorStops>
                            <dxc:ColorStop Color="#CCff5a19" Value1="22" Value2="30"/>
                            <dxc:ColorStop Color="#CCfead2d" Value1="30" Value2="38"/>
                            <dxc:ColorStop Color="#CCe5e335" Value1="38" Value2="46"/>
                            <dxc:ColorStop Color="#CCace45c" Value1="46" Value2="54"/>
                            <dxc:ColorStop Color="#CC6ec95b" Value1="54" Value2="64"/>
                        </dxc:CustomValueBandPointColorizer.ColorStops>
                    </dxc:CustomValueBandPointColorizer>
                </dxc:BubbleSeries.PointColorizer>
            </dxc:BubbleSeries>
        </dxc:ChartView.Series>

        <!-- Specify axis and legend settings here. -->
    </dxc:ChartView>
</ContentPage>