Lesson 4: Calculate Summaries
- 3 minutes to read
This document contains an overview of the DataGridView‘s data summaries and provides an example on how to calculate total and group summaries for orders in the grid created in Lesson 3.
Data Summaries - Overview
DataGridView allows you to display summary information about groups of rows or particular columns. For example, you can display the sum of values, the number of records, the minimum or maximum value, etc.
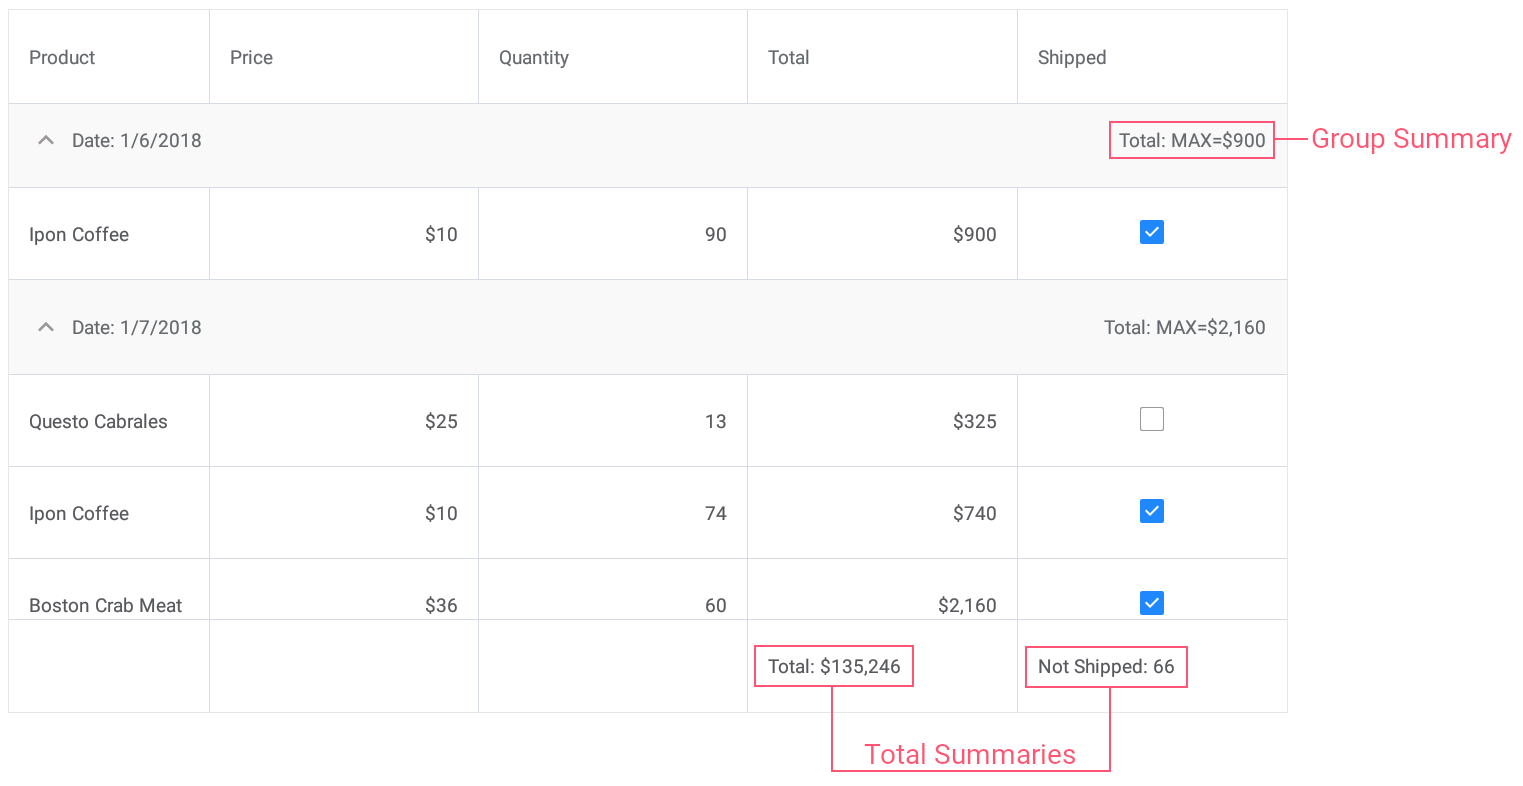
The grid supports two summary types:
Total Summary
An aggregate function value calculated over all rows in a column and displayed below this column.
Group Summaries
An aggregate function value calculated over all rows in a group and displayed in a group row.
A grid stores its total and group summaries in the DataGridView.TotalSummaries and DataGridView.GroupSummaries collections, respectively. An individual summary (group or total) is a GridColumnSummary object that contains the following summary settings:
- GridColumnSummary.FieldName - the field whose values are used to calculate the summary;
- GridColumnSummary.Type - the aggregate function;
- GridColumnSummary.DisplayFormat - the summary value format.
There are five predefined summary aggregate functions:
- Count - the number of data rows;
- Max and Min - the maximum and minimum values;
- Sum and Average - the sum and the average values.
You can also use custom rules to calculate summaries. To do this, set the GridColumnSummary.Type property to SummaryType.Custom, and handle the DataGridView.CalculateCustomSummary event.
Create Data Summaries - Example
Open the solution created in Lesson 3 and create the following summaries:
- Set the group summary to display the maximum Total value for each group of records.
- Set the total summary to calculate the sum of values in the Total column.
- Set the custom total summary to count a number of orders whose value in the Shipped column is false (to count orders that are not shipped).
You can add data summaries in XAML …
<dxg:DataGridView x:Name="grid" ItemsSource="{Binding Orders}"
                  CalculateCustomSummary="OnCalculateCustomSummary">
    <!-- ... -->
    <dxg:DataGridView.GroupSummaries>
        <dxg:GridColumnSummary FieldName="Total" Type="Max"/>
    </dxg:DataGridView.GroupSummaries>

    <dxg:DataGridView.TotalSummaries>
        <dxg:GridColumnSummary FieldName="Total" Type="Sum"
                               DisplayFormat="Total: {0:C0}"/>
        <dxg:GridColumnSummary FieldName="Shipped" Type="Custom"
                               DisplayFormat="Not Shipped: {0}"/>
    </dxg:DataGridView.TotalSummaries>
</dxg:DataGridView>
… or in code.
grid.GroupSummaries.Add (new GridColumnSummary {
    FieldName = "Total",
    Type = SummaryType.Max});

grid.TotalSummaries.Add (new GridColumnSummary () {
    FieldName = "Total",
    Type = SummaryType.Sum,
    DisplayFormat = "Total: {0:C0}"});
Now group summaries are displayed in group rows and total summaries are displayed in a total summary panel at the bottom of the grid.
The next lesson explains how to sort data in the grid.