Lesson 2: Create a Cartesian Chart
- 4 minutes to read
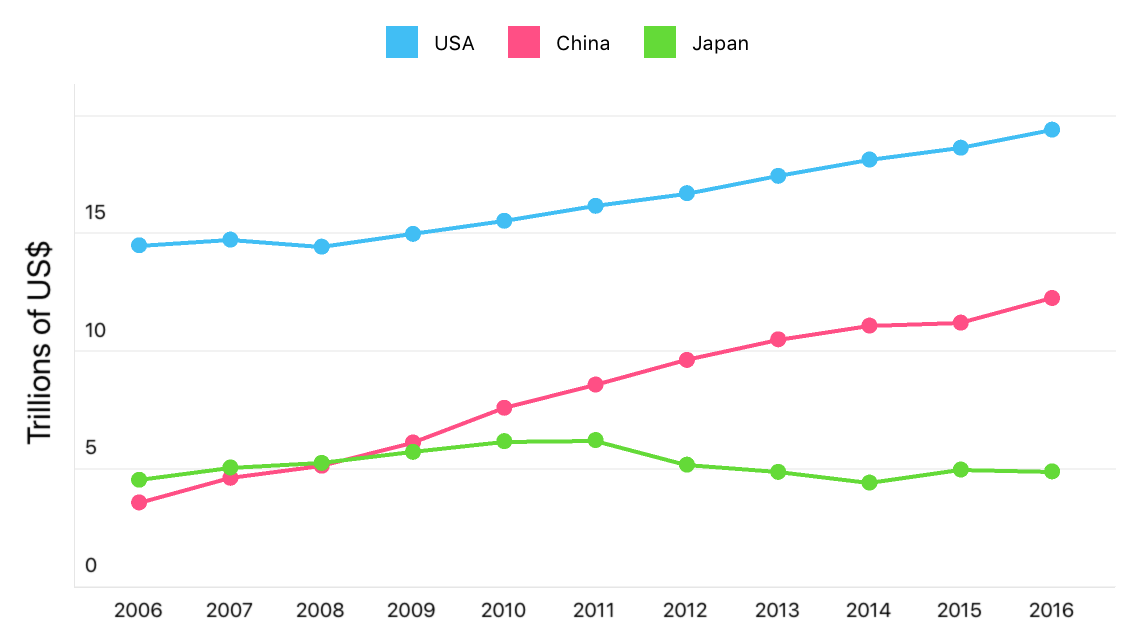
This guide explains how to use the Chart View and develop an application that displays three countries’ annual GDP in the Cartesian coordinate system.
Step 1: Create a New Application and Add a Chart View
- Create a new Xamarin.Forms cross-platform solution and include the DevExpress Charts component.
In the MainPage.xaml file of the .NET Standard project containing the shared code, use the dxc prefix to declare a namespace and replace the default page content with the ChartView control:
<ContentPage xmlns="http://xamarin.com/schemas/2014/forms"
            xmlns:x="http://schemas.microsoft.com/winfx/2009/xaml"
            xmlns:dxc="clr-namespace:DevExpress.XamarinForms.Charts;assembly=DevExpress.XamarinForms.Charts"
            x:Class="GettingStartedLesson2.MainPage">
    <dxc:ChartView x:Name="chart">
    </dxc:ChartView>
</ContentPage>
Step 2: Populate the Chart View with data
Create a new MainViewModel.cs file and add the following classes to it:
public class MainViewModel {
    public IReadOnlyCollection<Gdp> Gdps { get; }

    public MainViewModel() {
        Gdps = new List<Gdp> {
            new Gdp(
                "USA",
                new GdpValue(new DateTime(2017, 1, 1), 19.391),
                new GdpValue(new DateTime(2016, 1, 1), 18.624),
                new GdpValue(new DateTime(2015, 1, 1), 18.121),
                new GdpValue(new DateTime(2014, 1, 1), 17.428),
                new GdpValue(new DateTime(2013, 1, 1), 16.692),
                new GdpValue(new DateTime(2012, 1, 1), 16.155),
                new GdpValue(new DateTime(2011, 1, 1), 15.518),
                new GdpValue(new DateTime(2010, 1, 1), 14.964),
                new GdpValue(new DateTime(2009, 1, 1), 14.419),
                new GdpValue(new DateTime(2008, 1, 1), 14.719),
                new GdpValue(new DateTime(2007, 1, 1), 14.478)
            ),
            new Gdp(
                "China",
                new GdpValue(new DateTime(2017, 1, 1), 12.238),
                new GdpValue(new DateTime(2016, 1, 1), 11.191),
                new GdpValue(new DateTime(2015, 1, 1), 11.065),
                new GdpValue(new DateTime(2014, 1, 1), 10.482),
                new GdpValue(new DateTime(2013, 1, 1), 9.607),
                new GdpValue(new DateTime(2012, 1, 1), 8.561),
                new GdpValue(new DateTime(2011, 1, 1), 7.573),
                new GdpValue(new DateTime(2010, 1, 1), 6.101),
                new GdpValue(new DateTime(2009, 1, 1), 5.110),
                new GdpValue(new DateTime(2008, 1, 1), 4.598),
                new GdpValue(new DateTime(2007, 1, 1), 3.552)
            ),
            new Gdp(
                "Japan",
                new GdpValue(new DateTime(2017, 1, 1), 4.872),
                new GdpValue(new DateTime(2016, 1, 1), 4.949),
                new GdpValue(new DateTime(2015, 1, 1), 4.395),
                new GdpValue(new DateTime(2014, 1, 1), 4.850),
                new GdpValue(new DateTime(2013, 1, 1), 5.156),
                new GdpValue(new DateTime(2012, 1, 1), 6.203),
                new GdpValue(new DateTime(2011, 1, 1), 6.156),
                new GdpValue(new DateTime(2010, 1, 1), 5.700),
                new GdpValue(new DateTime(2009, 1, 1), 5.231),
                new GdpValue(new DateTime(2008, 1, 1), 5.038),
                new GdpValue(new DateTime(2007, 1, 1), 4.515)
            )
        };
    }
}

public class Gdp {
    public string Country { get; }
    public IReadOnlyList<GdpValue> Values { get; }

    public Gdp(string country, IEnumerable<GdpValue> values) {
        this.Country = country;
        this.Values = new List<GdpValue>(values);
    }
    public Gdp(string country, params GdpValue[] values) {
        this.Country = country;
        this.Values = new List<GdpValue>(values);
    }
}

public class GdpValue {
    public DateTime Year { get; }
    public double Value { get; }

    public GdpValue(DateTime year, double value) {
        this.Year = year;
        this.Value = value;
    }
}
In the code-behind MainPage.xaml.cs file, create a new class that implements the IXYSeriesData interface:
public class GdpDataAdapter : IXYSeriesData {
    public IReadOnlyList<GdpValue> ItemsSource { get; set; }

    SeriesDataType IXYSeriesData.GetDataType() => SeriesDataType.DateTime;
    int IXYSeriesData.GetDataCount() => (ItemsSource != null) ? ItemsSource.Count : 0;
    object IXYSeriesData.GetKey(int index) => ItemsSource[index];
    DateTime IXYSeriesData.GetDateTimeArgument(int index) => ItemsSource[index].Year;
    double IXYSeriesData.GetValue(DevExpress.XamarinForms.Charts.ValueType valueType, int index) {
        switch (valueType) {
            case DevExpress.XamarinForms.Charts.ValueType.Value: return ItemsSource[index].Value;
            default: throw new NotSupportedException();
        }
    }
    double IXYSeriesData.GetNumericArgument(int index) => throw new NotSupportedException();
    string IXYSeriesData.GetQualitativeArgument(int index) => throw new NotSupportedException();
}
In the MainPage’s constructor, create the MainViewModel object and use the data adapter class to provide data for the newly created series:
public MainPage() {
    InitializeComponent();

    var viewModel = new MainViewModel();
    BindingContext = viewModel;

    foreach(Gdp gdp in viewModel.Gdps) {
        chart.Series.Add(new LineSeries {
            DisplayName = gdp.Country,
            Data = new GdpDataAdapter {
                ItemsSource = gdp.Values
            },
            MarkersVisible = true
        });
    }
}
Step 3. Configure Chart Axes
Configure the Chart View’s argument axis so that it shows labels for each year, and customize the value axis labels’ content and position.
In the MainPage.xaml file, create a new DateTimeAxisX class instance, configure it, and assign it to the ChartView.AxisX property:
<dxc:ChartView x:Name="chart">
    <dxc:ChartView.AxisX>
        <dxc:DateTimeAxisX MeasureUnit="Year"
                           GridAlignment="Year"
                           GridSpacing="1"/>
    </dxc:ChartView.AxisX>
</dxc:ChartView>
Note
The X-axis type should be compatible with the series data type.
Create a new NumericAxisY class instance. Use its Title and Label properties to configure axis title and labels. Assign the axis to the ChartView.AxisY property:
<dxc:ChartView x:Name="chart">
<!-- The X-axis config is here. -->
    <dxc:ChartView.AxisY>
        <dxc:NumericAxisY>
            <dxc:NumericAxisY.Title>
                <dxc:AxisTitle Text="Trillions of US$">
                    <dxc:AxisTitle.Style>
                        <dxc:TitleStyle>
                            <dxc:TitleStyle.TextStyle>
                                <dxc:TextStyle Size="16"/>
                            </dxc:TitleStyle.TextStyle>
                        </dxc:TitleStyle>
                    </dxc:AxisTitle.Style>
                </dxc:AxisTitle>
            </dxc:NumericAxisY.Title>
            <dxc:NumericAxisY.Label>
                <dxc:AxisLabel TextFormat="#.#" Position="Inside"/>
            </dxc:NumericAxisY.Label>
        </dxc:NumericAxisY>
    </dxc:ChartView.AxisY>
</dxc:ChartView>
Step 4. Add a Legend to the Chart
Create a new Legend object, modify its settings, and assign it to the ChartBaseView.Legend property:
<dxc:ChartView x:Name="chart">
<!-- The axes config is here. -->
    <dxc:ChartView.Legend>
        <dxc:Legend VerticalPosition="TopOutside"
                    HorizontalPosition="Center"
                    Orientation="LeftToRight"/>
    </dxc:ChartView.Legend>
</dxc:ChartView>
Result
Launch the application to see the results: