Lesson 2: How to Create a Cartesian Chart
- 5 minutes to read
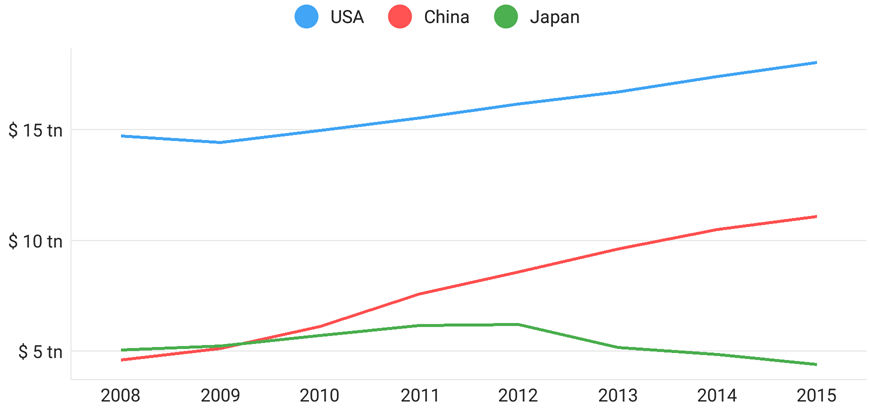
This guide introduces the DevExpress Charts Suite for Android and demonstrates how to create an application that displays 3 countries’ annual GDP. The following image demonstrates the result:
Step 1. Create a new application and add a chart
First, create a new single-view app and add the Chart to it by following the steps below.
Create a new application using your preferred IDE.
Import the library into the application’s project. The Import the DXCharts library guide explains how to do this.
Add a cartesian chart to a view. Replace the default component markup within the layout component with the following code in the Main Activity‘s markup file:
<com.devexpress.dxcharts.Chart
    android:id="@+id/chart"
    android:layout_width="wrap_content"
    android:layout_height="wrap_content"/>
Add the following code in the MainActivity class to import the DXCharts library and use its classes in the code:
Initialize a variable of the Chart type in the MainActivity‘s onCreate method, by finding the chart in the activity. After that, the method looks as follows:
Step 2. Populate a chart with data
This step populates the DXChart with series.
Create a new class that inherits the NumericSeriesData interface:
class GdpValue { int mYear; double mValue; public GdpValue(int year, double value) { mYear = year; mValue = value; } public int getYear() { return mYear; } public double getValue() { return mValue; } } public class GdpData implements NumericSeriesData{ List<GdpValue> mData = new List<>(); public GdpData(List<GdpValue> data){ mData = data; } public GdpData(GdpValue... data){ mData = Arrays.toList(data); } @Override public double getArgument(int i) { return mData.get(i).getYear(); } @Override public double getValue(int i) {return mData.get(i).getValue(); } @Override public int getDataCount() { return mData.size(); } }Then create a new Line series instance, set a data object with the specified parameters using the Series.setData(XYSeriesData) method, and add a series to the chart in the MainActivity class’s onCreate method:
LineSeries usaGdpSeries = new LineSeries(); usaGdpSeries.setDisplayName("USA"); usaGdpSeries.setData(new GdpData( new GdpValue(2008, 14.719), new GdpValue(2009, 14.419), new GdpValue(2010, 14.964), new GdpValue(2011, 15.518), new GdpValue(2012, 16.155), new GdpValue(2013, 16.692), new GdpValue(2014, 17.393), new GdpValue(2015, 18.037) )); chart.addSeries(usaGdpSeries);Add the other series to the chart:
LineSeries chinaGdpSeries = new LineSeries();
chinaGdpSeries.setDisplayName("China");
chinaGdpSeries.setData(new GdpData(new ArrayList<>(Arrays.asList(
      new GdpValue(2008, 4.598),
      new GdpValue(2009, 5.11),
      new GdpValue(2010, 6.101),
      new GdpValue(2011, 7.573),
      new GdpValue(2012, 8.561),
      new GdpValue(2013, 9.607),
      new GdpValue(2014, 10.482),
      new GdpValue(2015, 11.065)
))));
chart.addSeries(chinaGdpSeries);

LineSeries japanGdpSeries = new LineSeries();
japanGdpSeries.setDisplayName("Japan");
japanGdpSeries.setData(new GdpData(new ArrayList<>(Arrays.asList(
      new GdpValue(2008, 5.038),
      new GdpValue(2009, 5.231),
      new GdpValue(2010, 5.7),
      new GdpValue(2011, 6.157),
      new GdpValue(2012, 6.203),
      new GdpValue(2013, 5.156),
      new GdpValue(2014, 4.849),
      new GdpValue(2015, 4.383)
))));
chart.addSeries(japanGdpSeries);
Step 3. Configure chart axes
In this step, the arguments’ axis is configured to show labels for each argument. The text and position of the values’ axis‘s labels are customized.
Create a new NumericAxisX instance, configure it, and assign to the chart using the Chart.setAxisX(AxisX) method:
Then, create a new NumericAxisY instance, configure its labels’ options using an AxisLabel object, and assign the axis to the chart using the Chart.setAxisY(NumericAxisY) method:
Step 4. Add a legend to the chart
Finally, add a legend to the chart. To do this, create a new Legend object, modify its settings, and assign it to the chart.
Legend legend = new Legend();
legend.setHorizontalPosition(LegendHorizontalPosition.CENTER);
legend.setVerticalPosition(LegendVerticalPosition.TOP_OUTSIDE);
legend.setOrientation(LegendOrientation.LEFT_TO_RIGHT);
chart.setLegend(legend);
Note
If you are experiencing issues when using AAPT2, add the android.enableAapt2=false string to the gradle.properties file.
Result
Launch the application to see the results.