Lesson 1: How to Create a Pie Chart
- 5 minutes to read
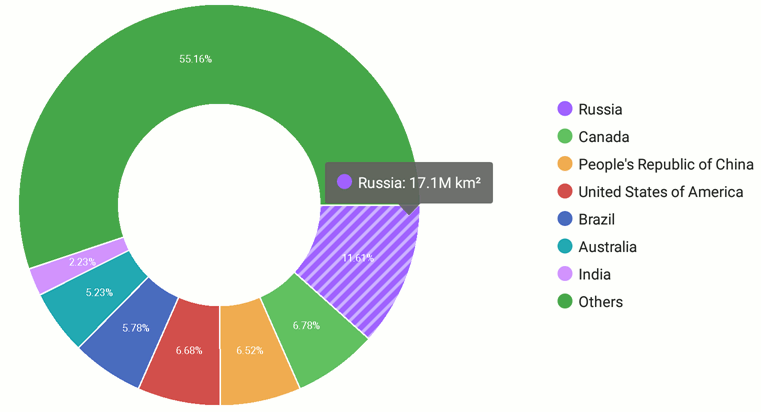
This guide introduces the DevExpress Charts Suite for Android and shows you how to create an application that displays land area by country.
Step 1. Create a New Application and Add a Pie Chart
First, you create a new single-view app and add the PieChart to the app by following steps below.
Create a new application using your preferred IDE.
Import the library into the application’s project. The Import the DXCharts library guide explains how to do this.
Add a pie chart to a view. Replace the default component markup within the layout component by the following code in the Main Activity’s markup file:
<com.devexpress.dxcharts.PieChart
    android:id="@+id/chart"
    android:layout_width="wrap_content"
    android:layout_height="wrap_content"/>
Add the following line in the MainActivity class to import the DXCharts library and use its classes in the code:
Initialize a variable of the PieChart type in the MainActivity‘s onCreate method, by finding the chart in the activity. After that, the method looks as follows:
Step 2. Populate the Pie Chart with Data
In this step, you create a pie series and populate it with data.
Create a new class that inherits the PieSeriesData interface:
class CountryInfo { String mName; double mArea; public CountryInfo(String name, double area) { mName = name; mArea = area; } public String getName() { return mName; } public double getArea() { return mArea; } } public class CountryAreaData implements PieSeriesData{ List<CountryInfo> mData; public CountryAreaData(ArrayList<CountryInfo> data){ mData = data; } public CountryAreaData(CountryInfo... data) { mData = Arrays.asList(data); } @Override public String getLabel(int i) { return mData.get(i).getName(); } @Override public double getValue(int i) {return mData.get(i).getArea(); } @Override public int getDataCount() { return mData.size(); } }Then, create a new DonutSeries class instance and assign a data object with the specified parameters to the series using the PieSeries.setData(PieSeriesData) method and add the series to the chart in the MainActivity class’s onCreate method:
DonutSeries countrySeries = new DonutSeries();
countrySeries.setData(new CountryAreaData(
        new CountryInfo("Russia", 17.098),
        new CountryInfo("Canada", 9.985),
        new CountryInfo("People's Republic of China", 9.597),
        new CountryInfo("United States of America", 9.834),
        new CountryInfo("Brazil", 8.516),
        new CountryInfo("Australia", 7.692),
        new CountryInfo("India", 3.287),
        new CountryInfo("Others", 81.2)
));
chart.addSeries(countrySeries);
Step 3. Modify the Pie Chart’s Tooltip
In this step, customize the text that the Pie Chart’s hints display.
Create a new PieHint class instance and assign it to the chart using the PieChart.setHint(PieHint) method. Then create a PieSeriesHintOptions class instance and assign it to the series using the PieSeries.setHintOptions(PieSeriesHintOptions) method. Use these options to specify a hint’s text pattern using the SeriesHintOptionsBase.setPointTextPattern(String) method:
Step 4. Configure the Pie Chart’s Appearance
Finally, you add the pie Chart’s legend, customize the palette used to color series, enable series labels, and modify the series’ appearance.
Create a new Legend object, modify its settings and assign it to the chart using the setLegend method:
Create a new PieChartStyle class instance and configure its parameters, then assign it to the Pie chart using the PieChart.setStyle(PieChartStyle) method:
Create the PieSeriesLabel class instance, modify label parameters, and assign the label to the series using the PieSeries.setLabel(PieSeriesLabel) method:
PieSeriesLabel seriesLabel = new PieSeriesLabel(); TextStyle textStyle = new TextStyle(); textStyle.setColor(Color.WHITE); textStyle.setSize(20f); seriesLabel.setStyle(new PieSeriesLabelStyle()); seriesLabel.getStyle().setTextStyle(textStyle); seriesLabel.setTextPattern("{VP}%"); seriesLabel.setPosition(PieSeriesLabelPosition.INSIDE); countrySeries.setLabel(seriesLabel);Specify how to highlight a selected pie slice using the PieChart.setSelectionBehavior(SelectionBehavior) method:
Note
If you are experiencing issues when using AAPT2, add the android.enableAapt2=false string to the gradle.properties file.
Result
Launch the application to see the result.