Obtain an Exception's Call Stack in Visual Studio
- 3 minutes to read
This article explains how to get an exception’s call stack in Visual Studio. This may be useful when you need to inform DevExpress Support about a problem that occurs at runtime and which you cannot reproduce step-by-step.
Get Exception Call Stack
Follow the steps below to catch user-handled exceptions in Visual Studio.
- Open Tools → Options… dialog, go to the Debugging node, and uncheck the Enable Just My Code (Managed Only) check box.
- Select the Debug → Windows → Exception Settings menu item (or press Ctrl+Alt+E). The Exceptions dialog appears. Enable the “Common Language Runtime Exceptions“ item.
- Reproduce the problem and open the Call Stack window (Debug | Windows | Call Stack).
- Select all text in the Call Stack window. Press Ctrl+C to copy the stack trace to the clipboard.
- Send the stack trace to DevExpress Support Center.
Refer to thew following article for more information: Manage exceptions with the debugger in Visual Studio.
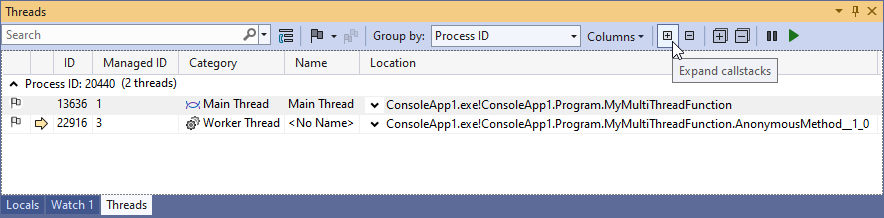
Get Exception Call Stack in Multiple Threads
When an exception relates to cross-thread communications, it is necessary to analyze stack traces in all threads. To obtain this information, click the Debug → Windows → Threads menu item. In the Threads window, click the Expand callstacks item in the toolbar, select and copy all lines.
Get Exception Call Stack on an End-User Machine
If the exception occurs on your end user’s machine (or anytime when it is impossible to attach a debugger to the application to obtain the call stack), you can handle the FirstChanceException event and save the exception’s call stack programmatically.
The code sample below illustrates how to save the log file to an end user’s desktop.
// Place this code to the Main() method in your application.
AppDomain.CurrentDomain.FirstChanceException += (sender, e) => {
     System.Text.StringBuilder msg = new System.Text.StringBuilder();
     msg.AppendLine(e.Exception.GetType().FullName);
     msg.AppendLine(e.Exception.Message);
     System.Diagnostics.StackTrace st = new System.Diagnostics.StackTrace();
     msg.AppendLine(st.ToString());
     msg.AppendLine();
     String desktopPath = Environment.GetFolderPath(Environment.SpecialFolder.Desktop);
     string logFilePath = String.Format("{0}\\{1}",desktopPath,"logfile.txt");
     System.IO.File.AppendAllText(logFilePath, msg.ToString());
 };
Get Exception Call Stack Of Design-Time Errors In Visual Studio
You can launch a new instance of Visual Studio and attach it to the first Visual Studio instance to collect an exception’s call stack.
- Open and launch the problematic project in the first Visual Studio.
- In the second Visual Studio, run the Debug → Attach to Processes command.
- In the invoked dialog, specify
devenv.exeas a process to debug, and click the Attach button. - Open Tools → Options… dialog, go to the Debugging node, and uncheck the Enable Just My Code (Managed Only) check box.
- Select the Debug → Windows → Exception Settings menu item (or press Ctrl+Alt+E). Enable Common Language Runtime Exceptions in the Exceptions dialog.
- Try to reproduce the problem in the first Visual Studio.
- Paste the stack trace information into your Issue Report in the DevExpress Support Center.