AxisPoint Class
A point on the data axis.
Namespace: DevExpress.DashboardCommon.ViewerData
Assembly: DevExpress.Dashboard.v19.1.Core.dll
Declaration
Remarks
The MultiDimensionalData object is used to hold hierarchical data displayed within the dashboard item in a unified way. The dimension value corresponding to a specific hierarchy level is stored in the AxisPoint class that defines a point in a multidimensional space. Such points are placed on a specific data axis that represented by the DataAxis class. For instance, the pivot grid has the “Row” and “Column” axes, the chart has the “Argument” and “Series” axes, etc. The DashboardDataAxisNames class provides access to names that allow you to identify various types of data axes.
To obtain the parent point for the current axis point, use the AxisPoint.Parent property. The AxisPoint.ChildItems property returns the collection of child axis points.
To obtain values related to the current axis point, use the AxisPoint.DimensionValue property.
Example
The following example demonstrates how to obtain client data corresponding to a particular visual element using DashboardViewer‘s API.
In this example, the DashboardViewer.DashboardItemClick event is handled to obtain client data for the Card dashboard item and display this data in a Chart control.
We obtain axis points placed on the “Sparkline” axis for the clicked card, determine corresponding actual/target values, and save these values to a data table. This table is used as a data source for the Chart control.
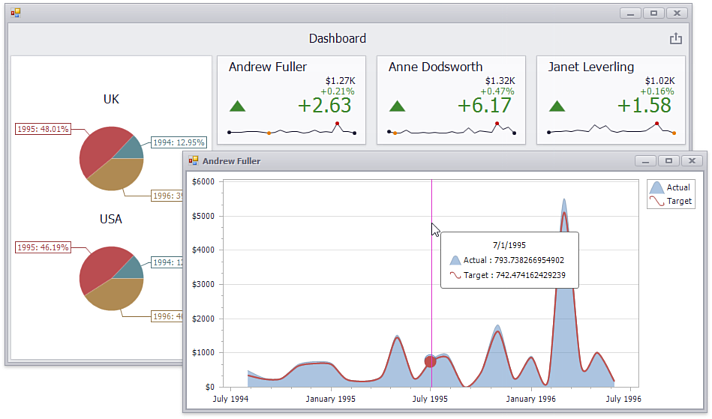
The Pie dashboard item demonstrates the master filtering feature. Click the slice and the Cards will display client data by the selected year.
Note
The complete sample project How to obtain a dashboard item’s client data in the WinForms Viewer is available in the DevExpress Examples repository.
using System;
using System.Data;
using System.Drawing;
using System.Windows.Forms;
using DevExpress.XtraEditors;
using DevExpress.DashboardWin;
using DevExpress.DashboardCommon;
using DevExpress.XtraCharts;
using DevExpress.DashboardCommon.ViewerData;

namespace Dashboard_ClientDataCards_Win {
    public partial class Form1 : XtraForm {
        public Form1() {
            InitializeComponent();
        }

        // Handles the DashboardViewer.DashboardItemClick event.
        private void dashboardViewer1_DashboardItemClick(object sender,
            DashboardItemMouseActionEventArgs e) {
            if (e.DashboardItemName == "cardDashboardItem1" & e.GetAxisPoint() != null) {
                // Obtains client data related to the clicked card.
                MultiDimensionalData clickedItemData = e.Data.GetSlice(e.GetAxisPoint());
                DeltaDescriptor delta = e.GetDeltas()[0];

                // Creates a data table that will be used to hold client data.
                DataTable dataSource = new DataTable();
                dataSource.Columns.Add("Argument", typeof(DateTime));
                dataSource.Columns.Add("Actual", typeof(double));
                dataSource.Columns.Add("Target", typeof(double));

                // Saves values of axis points placed on the "sparkline" axis and corresponding
                // actual/target values to the data table.
                foreach (AxisPoint point in
                    clickedItemData.GetAxisPoints(DashboardDataAxisNames.SparklineAxis)) {
                        DataRow row = dataSource.NewRow();
                        DeltaValue deltaValue = clickedItemData.GetSlice(point).GetDeltaValue(delta);
                        if (deltaValue.ActualValue.Value != null &&
                            deltaValue.TargetValue.Value != null) {
                            row["Argument"] = point.Value;
                            row["Actual"] = deltaValue.ActualValue.Value;
                            row["Target"] = deltaValue.TargetValue.Value;
                        }
                        else {
                            row["Argument"] = DBNull.Value;
                            row["Actual"] = DBNull.Value;
                            row["Target"] = DBNull.Value;
                        }
                        dataSource.Rows.Add(row);
                }
                DisplayDetailedChart(GetFormTitle(clickedItemData), dataSource);
            }
        }

        // Creates a new form that is invoked on the card click and
        // shows the chart displaying client data.
        void DisplayDetailedChart(string title, DataTable dataSource) {
            XtraForm form = new XtraForm();
            form.Text = title;
            form.Bounds = new Rectangle(100, 100, 700, 350);

            ChartControl chart = new ChartControl();
            chart.Parent = form; chart.Dock = DockStyle.Fill;

            Series series1 = new Series("Actual", ViewType.SplineArea);
            Series series2 = new Series("Target", ViewType.Spline);
            chart.Series.AddRange(new Series[] { series1, series2 });

            foreach (Series series in chart.Series) {
                series.DataSource = dataSource; series.ArgumentDataMember = "Argument";
                series.ValueScaleType = ScaleType.Numerical;
            }
            series1.ValueDataMembers.AddRange(new string[] { "Actual" });
            series2.ValueDataMembers.AddRange(new string[] { "Target" });
            ((XYDiagram)chart.Diagram).AxisY.Label.TextPattern = "{V:$0}";

            form.ShowDialog();
            form.Dispose();
        }

        // Obtains a value of the axis point placed on the "default" axis
        // to display this value in the invoked form title.
        string GetFormTitle(MultiDimensionalData clickedItemData) {
            AxisPoint clickedPoint =
                clickedItemData.GetAxisPoints(DashboardDataAxisNames.DefaultAxis)[0];
            string clickedPointValue = clickedPoint.Value.ToString();
            return clickedPointValue;
        }
    }
}