SimpleSeries Class
A Simple series.
Namespace: DevExpress.DashboardCommon
Assembly: DevExpress.Dashboard.v19.2.Core.dll
Declaration
Remarks
A Simple series presents regular two-dimensional data, in which each data point corresponds to one argument value and one Y-axis value.
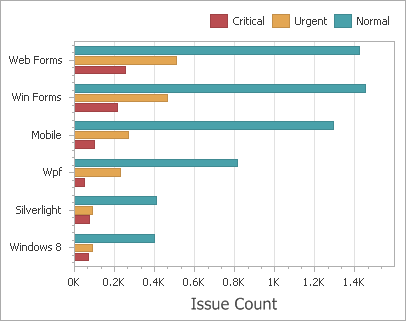
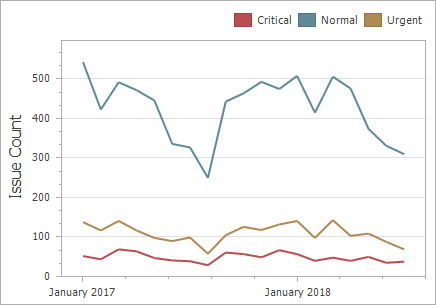
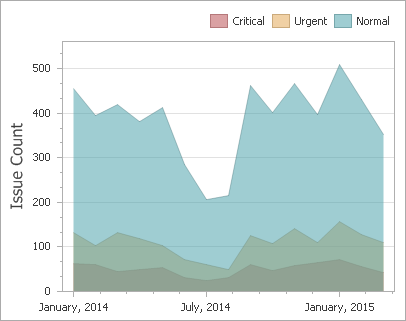
Simple series can be plotted in various ways: area, line or bar charts, etc. To specify how to plot a simple series, use the SimpleSeries.SeriesType property.
A Simple series requires one measure to calculate the Y-coordinates of data points. Use the SimpleSeries.Value property to specify this measure.
To plot a series within the ChartDashboardItem, add the SimpleSeries object to the ChartPane.Series collection of a pane where you need to display this series. To access a desired pane, use the ChartDashboardItem.Panes property.
Related GitHub Examples
The following code snippet (auto-collected from DevExpress Examples) contains a reference to the SimpleSeries class.
Note
The algorithm used to collect these code examples remains a work in progress. Accordingly, the links and snippets below may produce inaccurate results. If you encounter an issue with code examples below, please use the feedback form on this page to report the issue.