OpenHighLowCloseSeries Class
An Open-High-Low-Close series.
Namespace: DevExpress.DashboardCommon
Assembly: DevExpress.Dashboard.v19.1.Core.dll
Declaration
Remarks
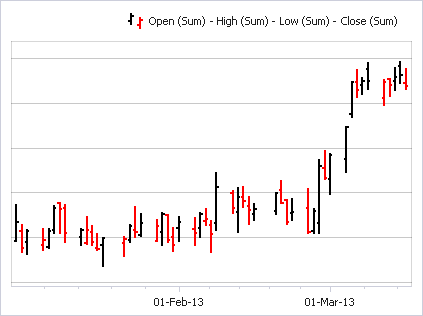
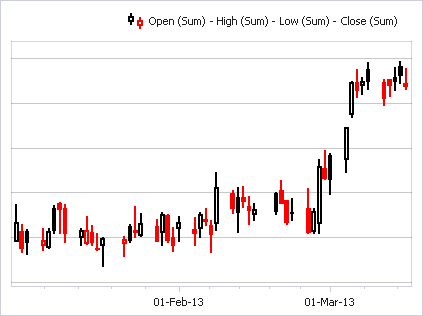
Open-High-Low-Close series are used to show variation in stock prices over the course of a day. The Low and High prices are represented by the bottom and top values of the vertical line which is shown at each point, and the Open and Close prices are represented by the left and right tick marks (the Stock series type) or the top and bottom borders of a rectangle (the Candle Stick series type).
If the stock closes lower than the close price for the previous time period, the point is painted in red. In the Candle Stick series, if the close price is lower than the opening price, the rectangle (body) is filled; otherwise, it is hollow.
To specify whether to use the Stock or Candle Stick presentation, use the OpenHighLowCloseSeries.SeriesType property.
An Open-High-Low-Close series requires four measures to be provided. These are measures containing the Open, High, Low and Close prices.
Use the following properties to specify these measures.
Gets or sets a measure that contains Open prices. | |
Gets or sets a measure that contains High prices. | |
Gets or sets a measure that contains Low prices. | |
Gets or sets a measure that contains Close prices. |
To plot a series within the ChartDashboardItem, add the OpenHighLowCloseSeries object to the ChartPane.Series collection of a pane where you need to display this series. To access a desired pane, use the ChartDashboardItem.Panes property.