BubbleMapDashboardItem Class
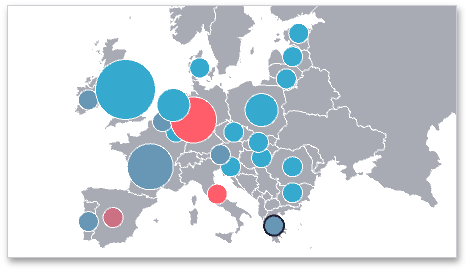
A Bubble Map dashboard item that allows you to place bubbles on the map using geographical coordinates.
Namespace: DevExpress.DashboardCommon
Assembly: DevExpress.Dashboard.v19.2.Core.dll
Declaration
Remarks
The Bubble Map dashboard item allows you to place bubbles on the map using geographical coordinates. Each bubble can represent data via its weight and color.
The following documentation is available.
Example
The following example demonstrates how to bind a Bubble Map dashboard item to data in code and customize the item’s palette.
Note
The complete sample project How to Bind a Bubble Map Dashboard Item to Data at Runtime is available in the DevExpress Examples repository.
using System;
using System.Collections.Generic;
using DevExpress.DashboardCommon;
using DevExpress.DataAccess.ConnectionParameters;
using DevExpress.DataAccess.Sql;
using DevExpress.XtraEditors;

namespace Dashboard_CreateBubbleMap {
    public partial class Form1 : XtraForm {
        public Form1() {
            InitializeComponent();
            dashboardViewer1.AsyncMode = true;
        }

        private void Form1_Load(object sender, EventArgs e) {
            Dashboard dashboard = new Dashboard();
            DashboardSqlDataSource dataSource = new DashboardSqlDataSource();
            dataSource.ConnectionParameters =
                new XmlFileConnectionParameters(@"..\..\Data\DashboardEnergyStatictics.xml");
            SelectQuery sqlQuery = SelectQueryFluentBuilder
                .AddTable("Countries")
                .SelectColumns("Latitude", "Longitude", "Production", "Import", "Country")
                .Build("Countries");

            dataSource.Queries.Add(sqlQuery);
            dashboard.DataSources.Add(dataSource);

            BubbleMapDashboardItem bubbleMap = new BubbleMapDashboardItem();
            bubbleMap.DataSource = dashboard.DataSources[0];
            bubbleMap.DataMember = "Countries";

            bubbleMap.Area = ShapefileArea.Europe;

            bubbleMap.Latitude = new Dimension("Latitude");
            bubbleMap.Longitude = new Dimension("Longitude");

            bubbleMap.Weight = new Measure("Production", SummaryType.Sum);
            bubbleMap.Color = new Measure("Import", SummaryType.Sum);
            bubbleMap.Color.NumericFormat.FormatType = DataItemNumericFormatType.General;

            bubbleMap.TooltipDimensions.Add(new Dimension("Country"));

            CustomizeScale(bubbleMap);
            ShowLegends(bubbleMap);

            dashboard.Items.Add(bubbleMap);
            dashboardViewer1.Dashboard = dashboard;
        }
        private void CustomizeScale(BubbleMapDashboardItem map) {
            CustomScale customScale = new CustomScale();
            List<double> rangeStops = new List<double>();

            customScale.IsPercent = false;

            rangeStops.Add(20);
            rangeStops.Add(200);
            rangeStops.Add(500);
            rangeStops.Add(2000);
            customScale.RangeStops.AddRange(rangeStops);

            map.ColorScale = customScale;
        }
        private void ShowLegends(BubbleMapDashboardItem map) {
            map.Legend.Visible = true;
            map.Legend.Orientation = MapLegendOrientation.Horizontal;
            map.WeightedLegend.Visible = true;
            map.WeightedLegend.Position = MapLegendPosition.BottomLeft;
        }
    }
}
Inheritance
Object
DashboardItem
DataDashboardItem
MapDashboardItem
GeoPointMapDashboardItemBase
BubbleMapDashboardItem
See Also