BubbleMapDashboardItem Class
A Bubble Map dashboard item that allows you to place bubbles on the map using geographical coordinates.
Namespace: DevExpress.DashboardCommon
Assembly: DevExpress.Dashboard.v18.2.Core.dll
Declaration
Remarks
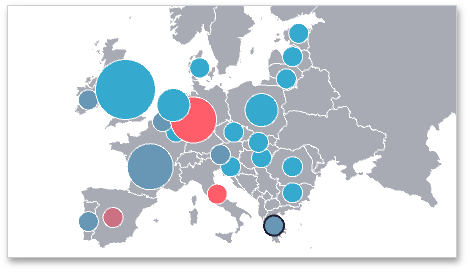
The Bubble Map dashboard item allows you to place bubbles on the map using geographical coordinates. Each bubble can represent data via its weight and color.
The following documentation is available.
Example
The following example demonstrates how to bind a Bubble Map dashboard item to data in code and customize its palette.
Note
A complete sample project is available at https://github.com/DevExpress-Examples/how-to-bind-a-bubble-map-dashboard-item-to-data-and-customize-its-palette-t119682.
using System;
using System.Collections.Generic;
using DevExpress.DashboardCommon;
using DevExpress.DataAccess.ConnectionParameters;
using DevExpress.DataAccess.Sql;
using DevExpress.XtraEditors;

namespace Dashboard_CreateBubbleMap {
    public partial class Form1 : XtraForm {
        public Form1() {
            InitializeComponent();
        }

        private void Form1_Load(object sender, EventArgs e) {
            // Creates a new dashboard and a data source for this dashboard.
            Dashboard dashboard = new Dashboard();
            DashboardSqlDataSource dataSource = new DashboardSqlDataSource();
            dataSource.ConnectionParameters =
                new XmlFileConnectionParameters(@"..\..\Data\DashboardEnergyStatictics.xml");
            SelectQuery sqlQuery = SelectQueryFluentBuilder
                .AddTable("Countries")
                .SelectColumns("Latitude", "Longitude", "Production", "Import", "Country")
                .Build("Countries");

            dataSource.Queries.Add(sqlQuery);
            dashboard.DataSources.Add(dataSource);

            // Creates a Bubble Map dashboard item and specifies its data source.
            BubbleMapDashboardItem bubbleMap = new BubbleMapDashboardItem();
            bubbleMap.DataSource = dashboard.DataSources[0];
            bubbleMap.DataMember = "Countries";

            // Loads the map of the world.
            bubbleMap.Area = ShapefileArea.Europe;

            // Provides cities' coordinates.
            bubbleMap.Latitude = new Dimension("Latitude");
            bubbleMap.Longitude = new Dimension("Longitude");

            // Specifies measures used to evaluate bubble weights and colors.
            bubbleMap.Weight = new Measure("Production", SummaryType.Sum);
            bubbleMap.Color = new Measure("Import", SummaryType.Sum);
            bubbleMap.Color.NumericFormat.FormatType = DataItemNumericFormatType.General;

            // Provides additional values displayed within bubble tooltips.
            bubbleMap.TooltipDimensions.Add(new Dimension("Country"));

            // Specifies a custom scale and shows map legends.
            CustomizeScale(bubbleMap);
            ShowLegends(bubbleMap);

            // Adds the Bubble Map dashboard item to the dashboard and opens this
            // dashboard in the Dashboard Viewer.
            dashboard.Items.Add(bubbleMap);
            dashboardViewer1.Dashboard = dashboard;
        }

        private void CustomizeScale(BubbleMapDashboardItem map) {
            CustomScale customScale = new CustomScale();
            List<double> rangeStops = new List<double>();

            // Specifies that the absolute scale is used to define a set of range stops.
            customScale.IsPercent = false;

            // Specifies custom range stops.
            rangeStops.Add(20);
            rangeStops.Add(200);
            rangeStops.Add(500);
            rangeStops.Add(2000);

            // Adds custom range stops to a custom scale.
            customScale.RangeStops.AddRange(rangeStops);

            map.ColorScale = customScale;
        }

        private void ShowLegends(BubbleMapDashboardItem map) {
            // Enables map legends and specifies its position and orientation.
            map.Legend.Visible = true;
            map.Legend.Orientation = MapLegendOrientation.Horizontal;
            map.WeightedLegend.Visible = true;
            map.WeightedLegend.Position = MapLegendPosition.BottomLeft;
        }
    }
}
Inheritance
Object
DashboardItem
DataDashboardItem
MapDashboardItem
GeoPointMapDashboardItemBase
BubbleMapDashboardItem
See Also