Create a Dashboard in Visual Studio (.NET)
- 3 minutes to read
Prerequisites
Create a WPF Dashboard Viewer application with the Dashboard Viewer that targets .NET 5 or later versions. Refer to the following tutorial for more information: Create a WPF Dashboard Viewer (.NET).
Visual Studio 2019 v16.8 or later with the .NET desktop development workload.
Create a Dashboard
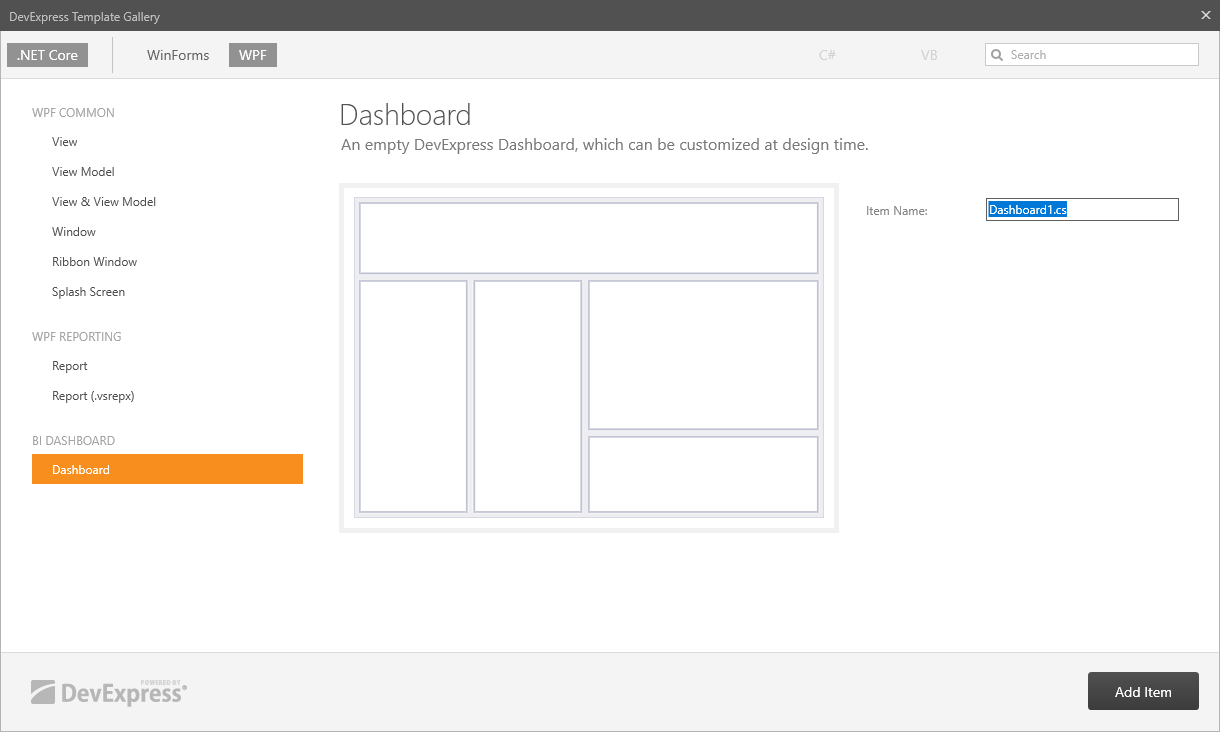
Right-click the project in the Solution Explorer and select Add DevExpress Item | New Item…. This will start the DevExpress Template Gallery wizard. Select the WPF platform and the Dashboard item, as shown below:
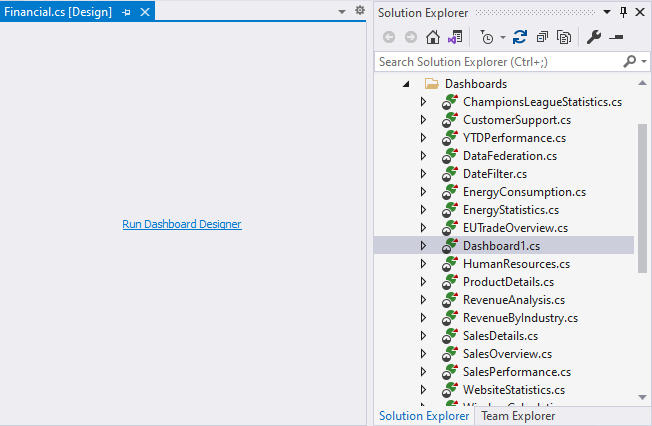
Rebuild the project before you invoke the Dashboard Designer.
Double-click the created dashboard in the VS Solution Explorer window and select Run Dashboard Designer.
Configure the Dashboard
The following sections describe how to design the created dashboard. Refer to the following topic for more information about functionality that is available in the Dashboard Designer’s UI: Create Dashboards in the WinForms Designer.
Connect to a Database and Select Data
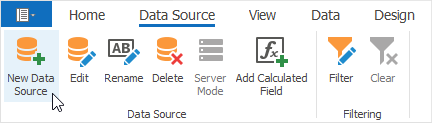
Select New Data Source in the Data Source ribbon tab.
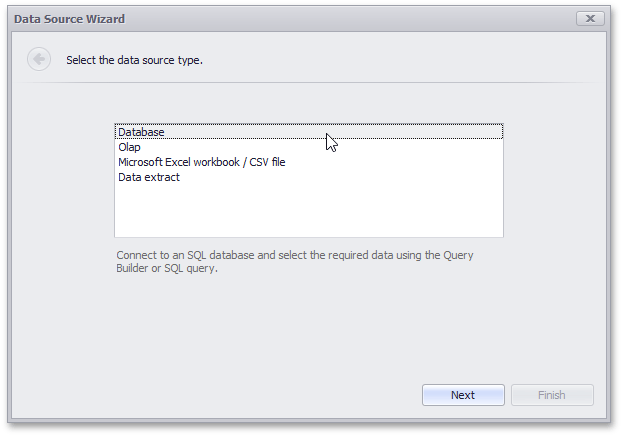
Select Database and click Next on the first page.
Important
This example uses an Access 97 Database file shipped with the installation package as the data source.
Specify data connection parameters. Select the data provider to Microsoft Access 97 and specify the following path to the database in the Database field:
C:\Users\Public\Documents\DevExpress Demos 22.1\Components\Data\nwind.mdb
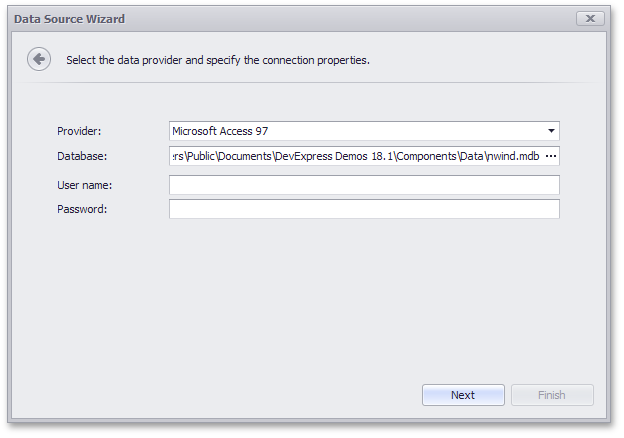
Click Next.
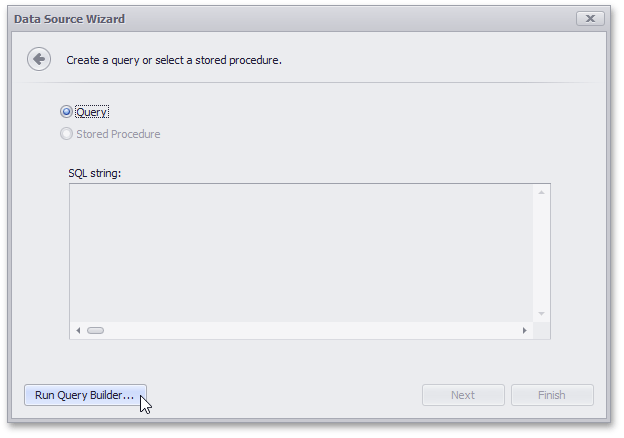
On the final page, click the Run Query Builder… button to run Query Builder.
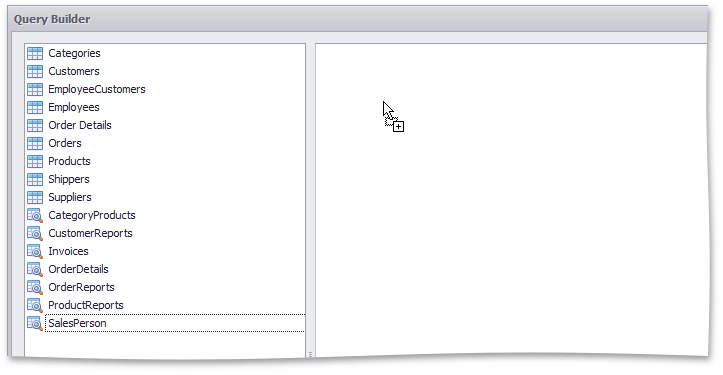
In the invoked Query Builder, drag and drop the SalesPerson view from Tables Pane on the left to the Design Pane.
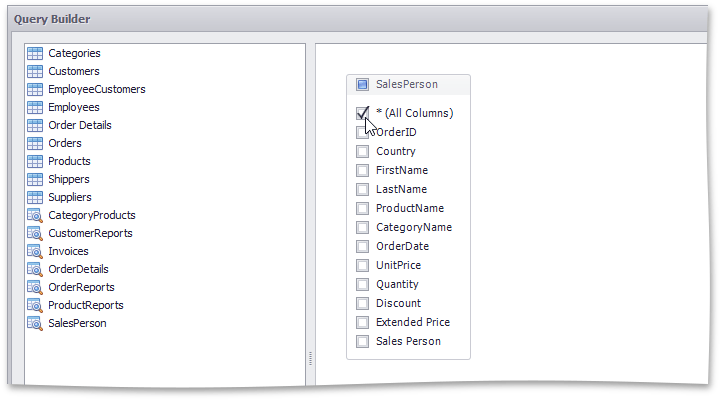
Check the (All Columns) check box and click OK.
The Data Source Wizard displays the generated query.
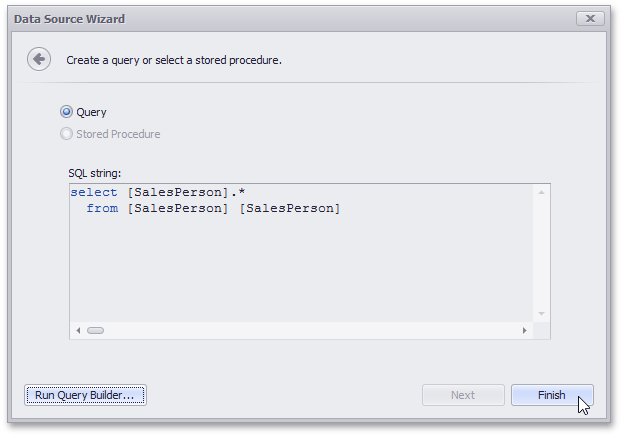
Click Finish to create the data source.
Create Dashboard Items and Bind them to Data
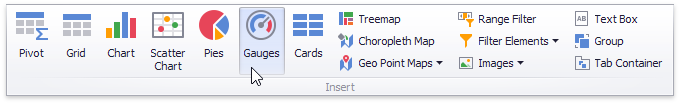
Click the Gauges button in the Ribbon to add gauges.
Drag the Extended Price field from the Data Source Browser to the “Actual” placeholder in the Gauges section.
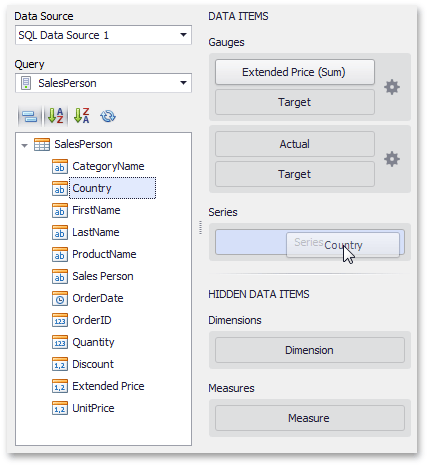
Then, drag the Country field to the Series section.
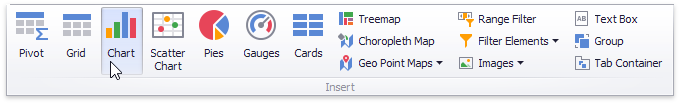
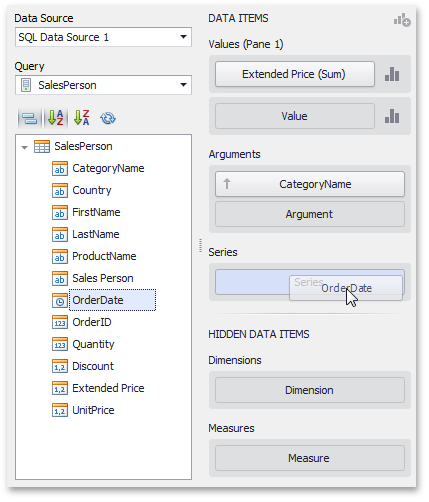
Click the Chart button in the Ribbon to add a chart.
Drag the Extended Price field to the Values section, the CategoryName field to the Arguments section, and the OrderDate field to the Series section.
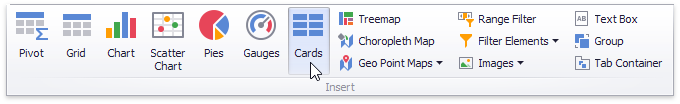
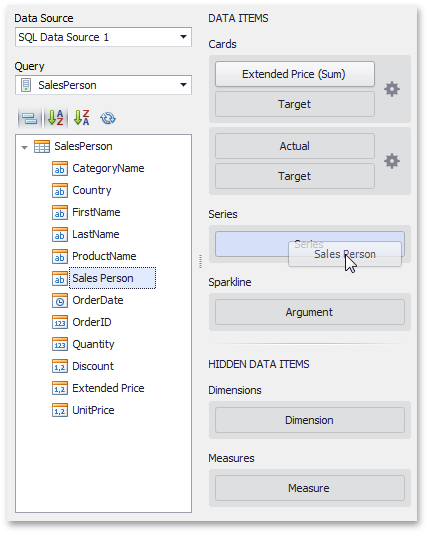
Click the Cards button in the Ribbon to add cards.
Drag the Extended Price field to the “Actual” placeholder in the Cards section. Then, place the Sales Person field in the Series section.
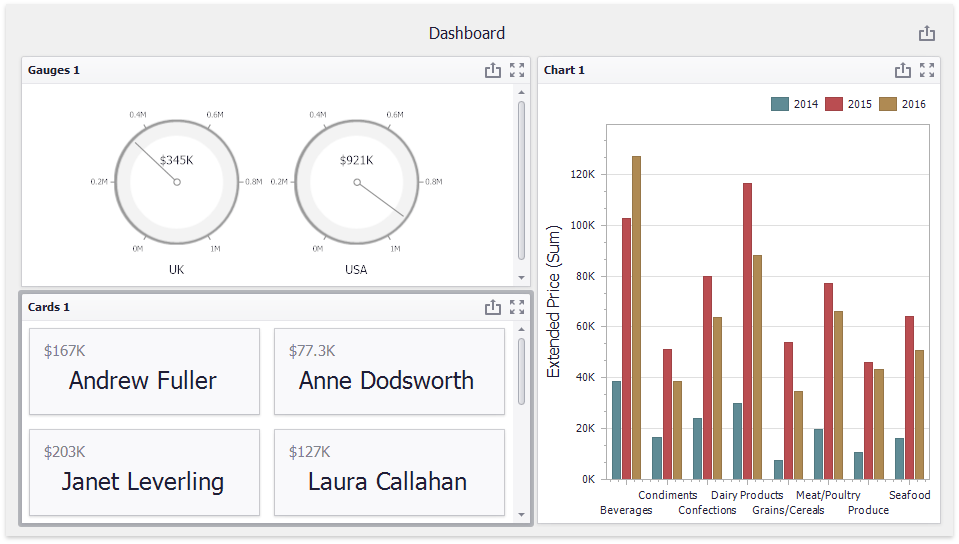
The dashboard looks like this:
Save the Dashboard
Click Save in the Ribbon or Save As to select a destination to save the dashboard in an XML file.
Edit a Dashboard
Double-click the existing dashboard in the VS Solution Explorer window and select Run Dashboard Designer.
Edit the dashboard in the invoked Dashboard Designer. The following image illustrates the Dashboard Designer in Visual Studio that contains a dashboard:
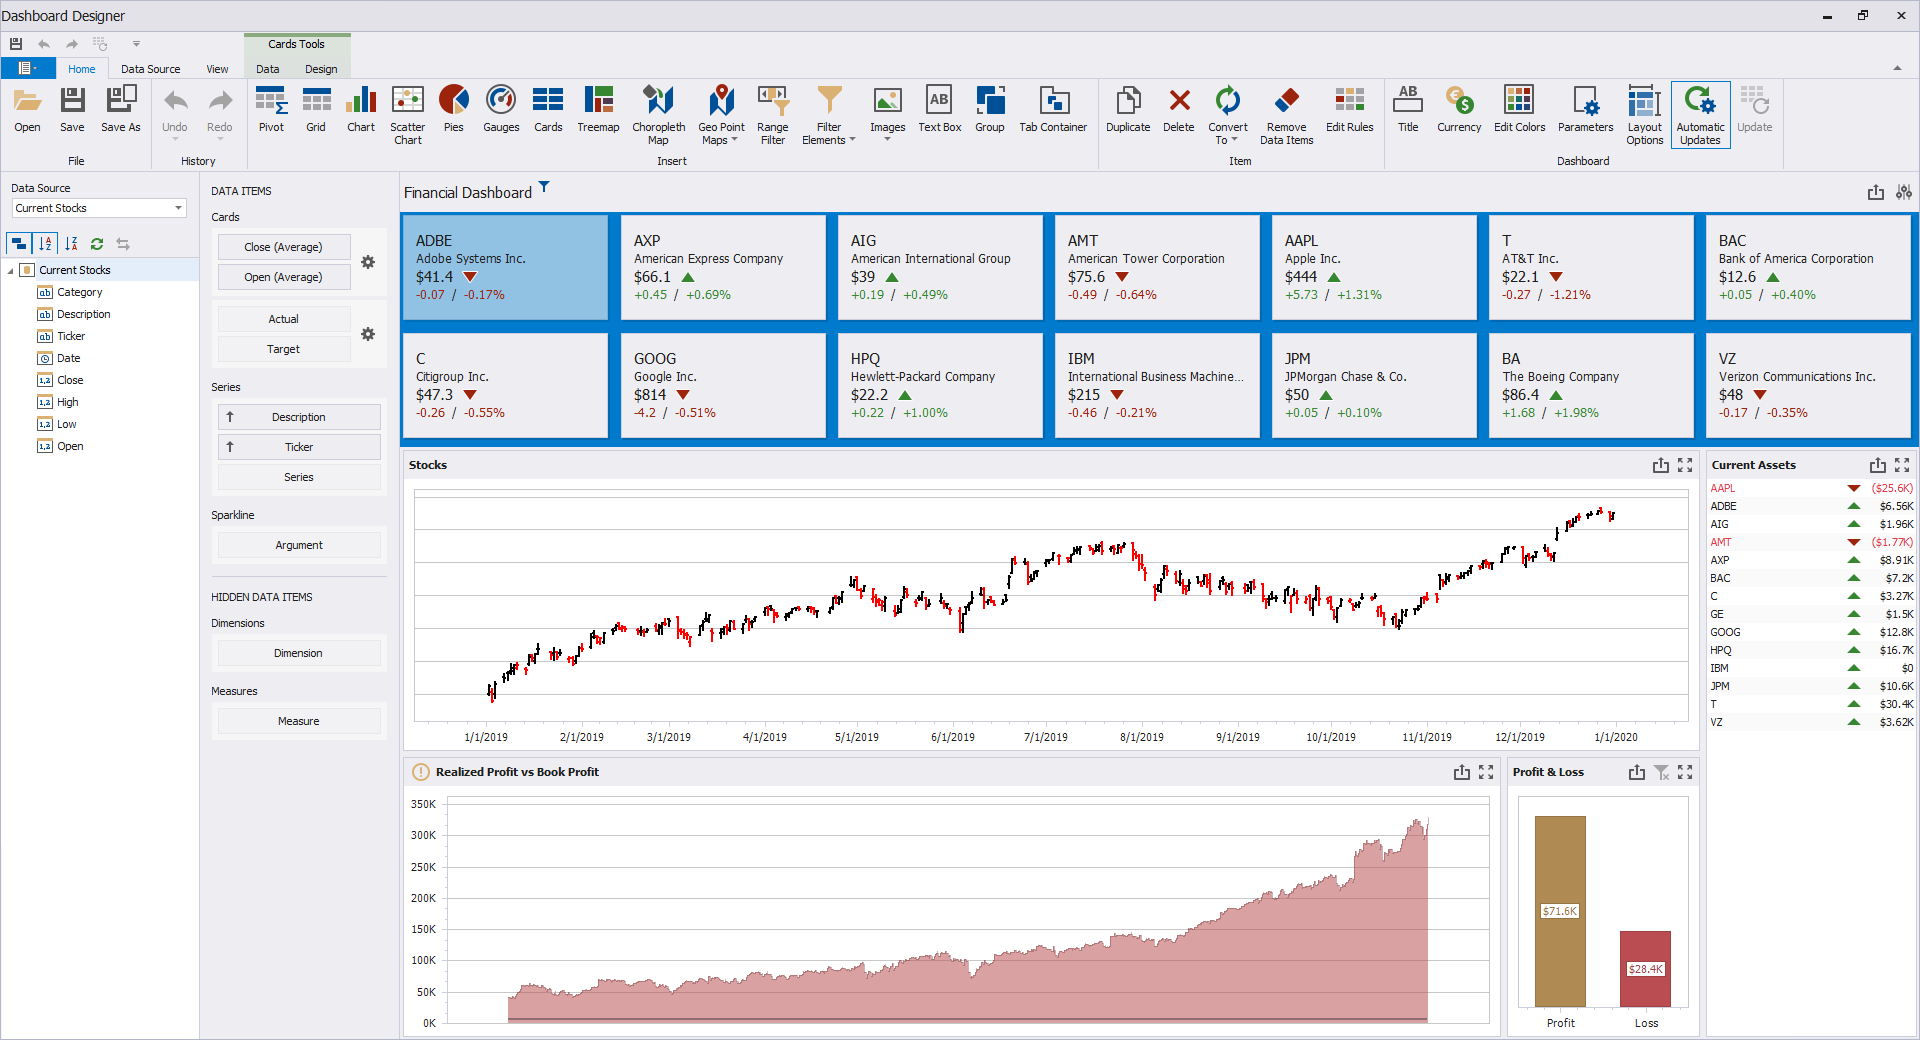
Save the resulting dashboard.
Next step
WPF Viewer - describes how to use DashboardControl to display a dashboard in a WPF application.