Conditional Formatting
- 4 minutes to read
Use conditional formatting to highlight chart elements such as bars, lines, areas, and data points.
The following series types support conditional formatting:
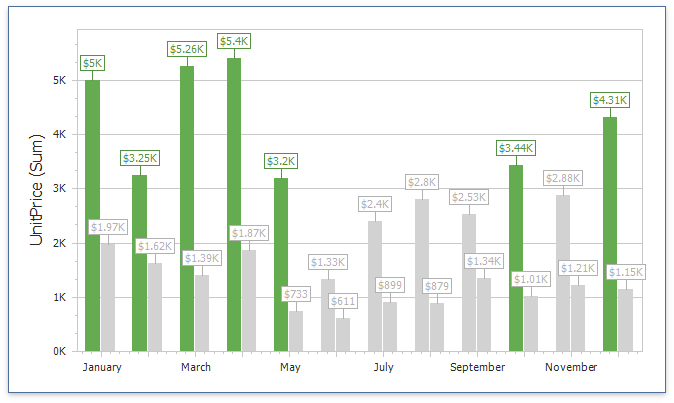
Bar Series Type Chart
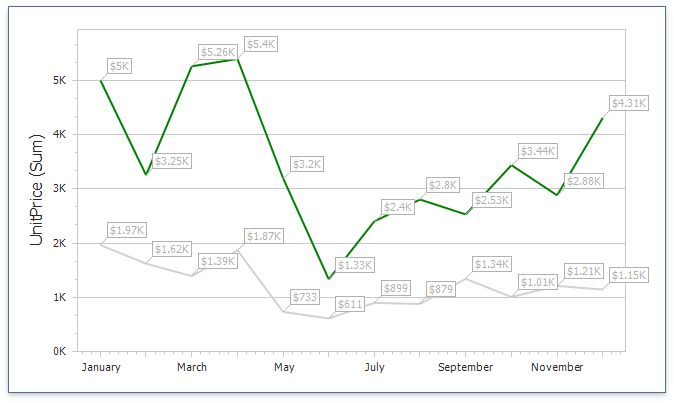
Line Series Type Chart
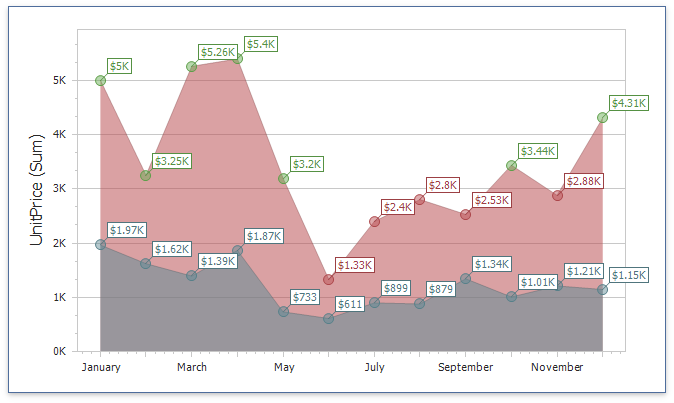
Area Series Type Chart
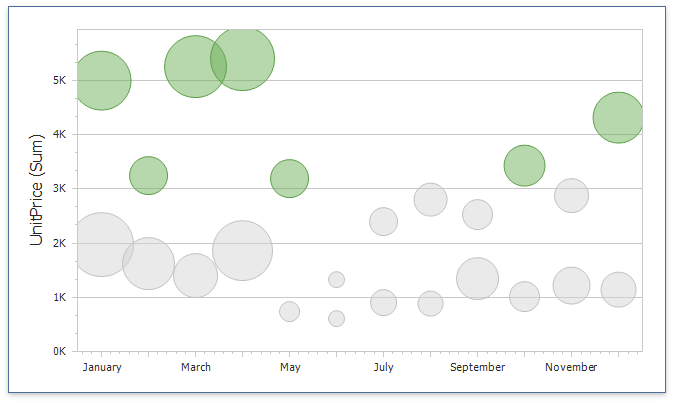
Bubble Series Type Chart
Range Bar Series Type Chart
Supported Format Rules
You can use the following data in rule calculations:
- measures from the Values section
- dimensions from the Arguments/Series section
- hidden measures
The following table lists available format rules and corresponding data types:
Data Type | Supported Format Rules |
|---|---|
numeric | |
string | Value with the condition type set to Equal To, Not Equal To or Text that Contains |
date-time |
A Date Occurring for dimensions with the continuous date-time group interval |
Refer to the Conditional Formatting Basics topic for more information about format condition types.
Create and Edit a Format Rule
You can create and edit format rules in the following ways:
Click the Edit Rules button on the Home ribbon tab.
Click the measure/dimension menu button in the Data Item’s pane and select Add Format Rule/Edit Rules.
Refer to the following topic for information on how to create and edit format rules: Conditional Formatting in Windows Designer.
Chart-Specific Format Condition Settings
Specify appearance settings and set the condition’s value to create a format rule. Available settings depend on the selected format condition type.
The image below displays the Greater Than dialog (a Value format condition applied to a chart). The condition colors points/bars if their values exceed 3000.
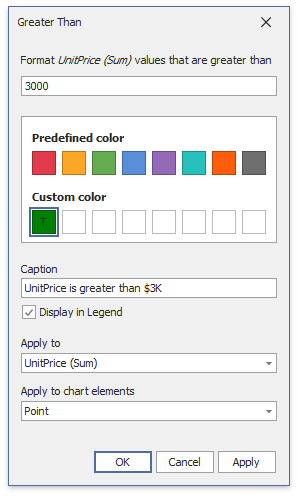
Enable Display in Legend to add information about the applied rule to the chart. Set the Caption field to specify the legend’s text. For Range format rules the legend’s text is generated automatically and depends on the range intervals.
Use the Apply to chart elements drop-down list to apply a rule on points or lines.
- Point: A rule applies to the data-points such as bars, points and bubbles.
- Line/Area: A rule applies to lines and areas.
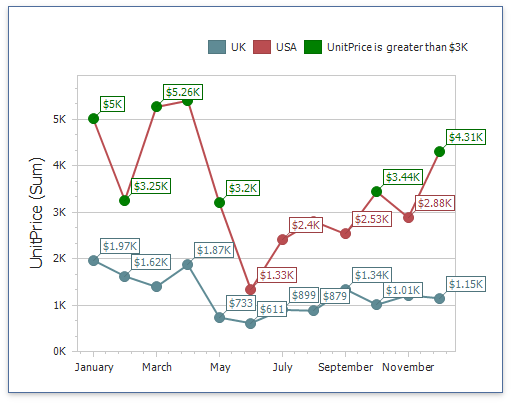
The image below displays the Chart item with the applied Greater Than format rule. The Apply to chart elements option is set to Point and the rule is applied to points of the line series.
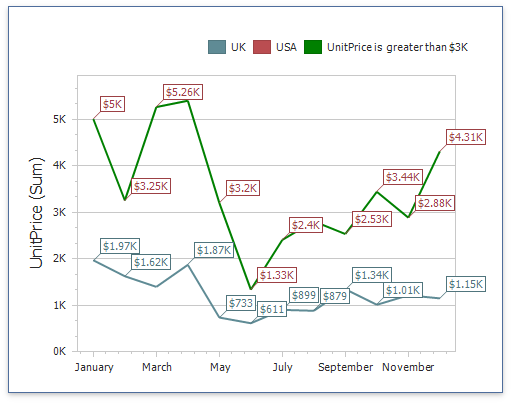
If you select Line/Area, the format rule applies to the line when at least one line point meets the rule’s condition:
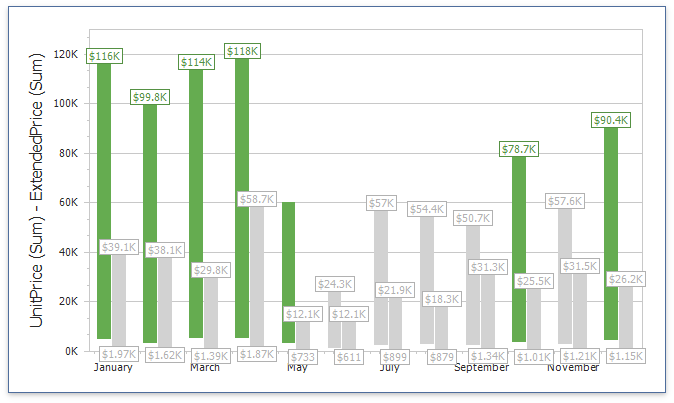
Coloring
A Chart item paints elements in pale gray if they do not meet the applied format condition. Note that this does not apply to elements that use the Hue color mode (the Dimension.ColoringMode property is set to Hue).
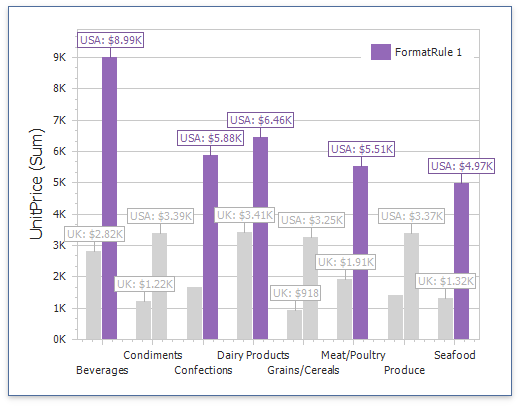
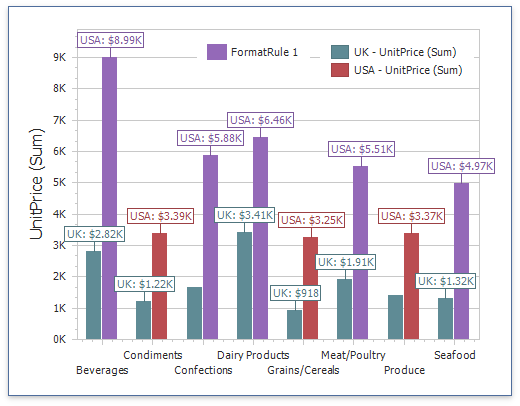
Select Color by Hue option in a Data item’s pane to restore the color scheme.
Tip
Documentation: Chart - Coloring
Create a Format Rule in Code
Create a ChartItemFormatRule object and specify its settings to add a format rule:
- Create a condition (a FormatConditionBase descendant), specify its settings, and assign it to the DashboardItemFormatRule.Condition property.
- Assign a data item (a measure/dimension) to the ChartItemFormatRuleBase.DataItem property. The data item’s value is used to calculate the condition.
- Use the ChartItemFormatRule.ApplyToSeries property to specify the series to which a format rule is applied.
- Assign a FormatRuleChartElement value to the ChartItemFormatRule.ApplyToChartElement property. This property specifies the chart element to be highlighted.
- Add the format rule to the ChartDashboardItem.FormatRules collection.
Set ChartItemFormatRuleBase.ShowInLegend property to true to display a rule in a chart’s legend. Use the ChartItemFormatRuleBase.DisplayName property to specify the rule’s caption that is displayed in a legend.
The following code snippet shows how to apply the Gradient Range and Value rules to the Chart Dashboard item:
public Form1() {
    InitializeComponent();
    ChartDashboardItem chart1 = (ChartDashboardItem)dashboardDesigner1.Dashboard.Items["chartDashboardItem1"];
    ChartDashboardItem chart2 = (ChartDashboardItem)dashboardDesigner1.Dashboard.Items["chartDashboardItem2"];
    AddFormatRulesToBarSeries(chart1);
    AddFormatRulesToLineSeries(chart2);
}
public void AddFormatRulesToBarSeries(ChartDashboardItem chart) {
    SimpleSeries series = chart.Panes[0].Series[0] as SimpleSeries;
    ChartItemFormatRule gradientRule = new ChartItemFormatRule(series.Value, series);
    FormatConditionRangeGradient condition = new FormatConditionRangeGradient(FormatConditionRangeGradientPredefinedType.RedBlue);
    gradientRule.Condition = condition;
    gradientRule.ShowInLegend = false;
    chart.FormatRules.Add(gradientRule);
}
public void AddFormatRulesToLineSeries(ChartDashboardItem chart) {
    SimpleSeries series = chart.Panes[0].Series[0] as SimpleSeries;
    ChartItemFormatRule valueRule1 = new ChartItemFormatRule(series.Value, series);
    FormatConditionValue valueCondition1 = new FormatConditionValue(DashboardFormatCondition.Greater, 3000);
    valueCondition1.StyleSettings = new ColorStyleSettings(Color.Green);
    valueRule1.Condition = valueCondition1;
    valueRule1.ShowInLegend = true;
    valueRule1.Description = "UnitPrice greater than $3K";
    chart.FormatRules.Add(valueRule1);
}