How to: Use Dashboard Items in Tab Pages as Independent Master Filters
This example demonstrates how to implement a custom visual interactivity that enables the Grid dashboard items placed in different tab pages to act as independent master filters.
The example uses the following API:
The DashboardDesigner.DashboardItemSelectionChanged event is handled to assign selected values to a dashboard’s parameter and save them in a variable.
The DashboardDesigner.DashboardItemVisualInteractivity event is handled to restore the selected values and highlight a grid row.
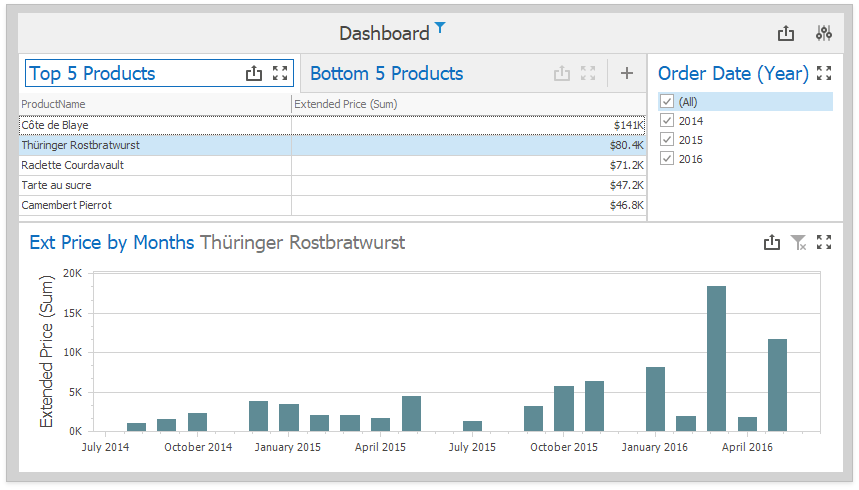
The DashboardDesigner.CustomizeDashboardItemCaption event displays the filter value in the Chart item’s caption.
The DashboardDesigner.ConfigureDataConnection event specifies the Extract Data Source file location at runtime.
Note
The complete sample project How to Use Dashboard Items in Tab Pages as Independent Master Filters is available in the DevExpress Examples repository.