Cascading Lookup With Master Filters
- 2 minutes to read
This document describes how to combine filter items and groups in a dashboard to create a cascading lookup filter.
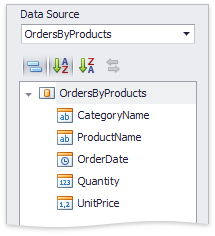
The data source used in this example has no nested fields or relationships between data sources.
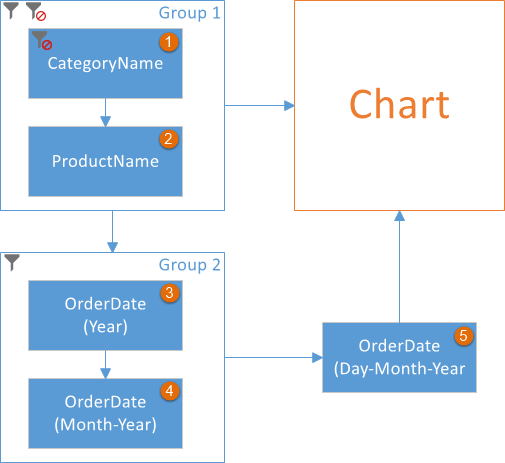
Create the first cascade level. For this, add a List Box filter item to the dashboard and set its Dimension to the CategoryName field. The default Ignore Master Filters setting is on for the filter item.
To create the second level, add another ListBoxDashboardItem with the Dimension set to the ProductName field. Switch off its Ignore Master Filters setting so that the CategoryName filter can affect the ProductName filter. This establishes a one-way lookup between the CategoryName and the ProductName fields.
To create the third cascade level, add the ListBoxDashboardItem with the Dimension set to the OrderDate field grouped by Year. This element filters the ProductName element and vice versa (a two-way lookup). However, the lookup should be performed in one direction to create a cascade.
To protect the ProductName filter element from filtering by other elements, move it in a group and set the group’s interactivity Ignore Master Filters option to on. Move the CategoryName filter in the same group - this retains one-way lookup between the CategoryName and the ProductName fields. The filters are locked up within the Group item. To let them affect the items outside the group, set the group’s Master Filter option to on.
To create the fourth cascade level, move the OrderDate(Year) filter in another Group container item and add the list box items bound to the OrderDate field grouped by Month-Year. Set the the group’s Master Filter option to on to allow OrderDate filter values participate in a Master Filter outside the group.
The fifth cascade level is also possible. Add the list box with the Dimension set to the OrderDate field grouped by Day-Month-Year to the dashboard. It will be affected by the Group 2 filter values.
The diagram below illustrates how the filters affect each other until they are applied to the Chart dashboard item that displays the filtered data.
Refer to the How to: Create a Cascading Lookup Filter and Apply it Across Tab Pages and Data Sources document for a sample dashboard.