Underlying and Displayed Data
- 6 minutes to read
The DashboardControl API allows you to obtain underlying data from the dashboard data source and client data displayed within the dashboard item.
Dashboard Item Data
The dashboard aggregates and visualizes data from the underlying data source, creating the inner pivot table that is the MultiDimensionalData object instance. Use the DashboardControl.GetItemData method to obtain all data for a dashboard item specified by its ComponentName.
Data Structure
The MultiDimensionalData object is the data storage for any dashboard item, regardless of the item type. A chart, a grid, a map or a card - all they store its data in a uniform multidimensional type resembling a pivot table. This approach has its advantages - the consistency and compact API, and disadvantages - simple item-specific actions results in complex API expressions.
Consider the PivotDashboardItem shown in the picture below.
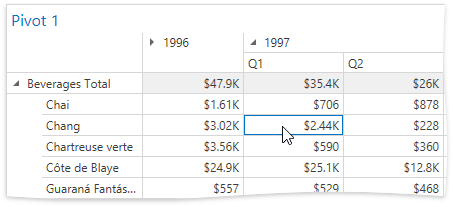
A selected cell displays the Measure value of the MultiDimensionalData object obtained by slicing the dashboard item data object (the current MultiDimensionalData object) against the AxisPoints on the Row and Column data axes.
Dimension Values and Axis Points
A dimension value is stored in the AxisPoint class, comprising a point located on a data axis (the DataAxis class). Dimension values for the selected cell are stored in two AxisPoints - one for the Row axis, another for the Column axis.
Different dashboard items have different axis names. The pivot grid has the Row and “ axes, the chart has the Argument and Series axes, other items may have the Default axis. The static DashboardDataAxisNames class contains valid axis names. You can use class properties to specify axes in method parameters.
The AxisPoints, shown in the picture, have the following properties that return dimension values:
| Property | Column AxisPoint Value | Row AxisPoint Value |
|---|---|---|
| DisplayText | Q1 | Chang |
| Value | 1 | Chang |
| UniqueValue | 1 | Chang |
Dimension values comprise an hierarchy of AxisPoints represented as tree-like structure. An AxisPoint is a tree node and has a parent and child nodes. The Column AxisPoint related to the selected cell in the picture has one parent AxisPoint (its display text is “1997”) and no child AxisPoints. The related Row AxisPoint in the picture has one parent AxisPoint (its display text is “Beverages”) and no child AxisPoints.
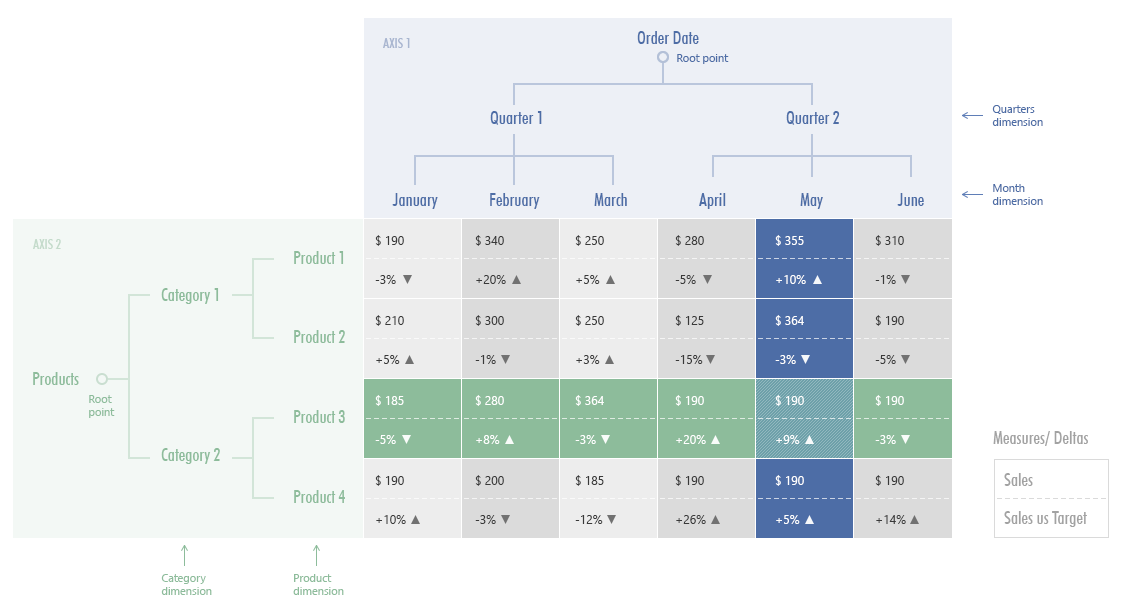
The image below illustrates how hierarchical data is stored in the MultiDimensionalData object.
The MultiDimensionalData.GetDimensions method, called with the valid axis name as the parameter, returns the collection of DimensionDescriptor objects. A DimensionDescriptor contains the dimension name, identifier, grouping characteristics and the data member name used to populate the dimension with data.
To access dimension values, obtain axis points located on the required data axis. Use the following methods:
| Method | Description |
|---|---|
| MultiDimensionalData.GetAxisPoints | Gets data points belonging to the specified axis. |
| MultiDimensionalData.GetAxisPointsByDimension | Gets axis points corresponding to the specified dimension. |
As an alternative, obtain the required data axis by calling the MultiDimensionalData.GetAxis method. The returned DataAxis object exposes the DataAxis.GetPoints method that returns axis points of the current axis.
Slicing
The MultiDimensionalData.GetSlice method returns the slice of the current MultiDimensionalData object by the specified axis point. In the picture above, the slice by the “Product 3” axis point is shown shaded in green. It contains Measure values for all date intervals. The slice by the “May” axis point is shown shaded in blue, it contains Measure values for all products. If you sequentially call the GetSlice method two times, you can obtain the slice at the intersection of the “Product 3” and “May” axis points. It is the cell MultiDimensionalData object, whose MultiDimensionalData.GetValue method returns the Measure value displayed in the cell.
Considering the Pivot Item picture in the beginning of the article, the following code returns the “$2.44K” string displayed in the cell:
DashboardItem dashboardItem = dashboardControl1.Dashboard.Items.FirstOrDefault(i => i.Name == "Pivot 1");
MultiDimensionalData displayedData = dashboardControl1.GetItemData(dashboardItem.ComponentName);
MultiDimensionalData sliceByRow = displayedData.GetSlice(DashboardDataAxisNames.PivotRowAxis, new object[] { "Beverages", "Chang" });
MultiDimensionalData sliceByRowAndColumn = sliceByRow.GetSlice(DashboardDataAxisNames.PivotColumnAxis, new object[] { 1997, 1 });
MeasureValue cellValue = sliceByRowAndColumn.GetValue(mdata.GetMeasures()[0]);
string cellDisplayedText = cellValue.DisplayText;
The slice of the MultiDimensionalData object can be described by the AxisPointTuple class instance containing a set of axis points. The AxisPointTuple class is used in the following methods:
- GetAvailableDrillDownValues(String)
- GetCurrentDrillDownValues(String)
- PerformDrillDown(String, AxisPointTuple)
- GetAvailableFilterValues(String)
- GetCurrentFilterValues(String)
- SetMasterFilter(String, AxisPointTuple)
You can get an AxisPointTuple that describes the drill-down in one control and perform drill-down in another control of the same type and bound to the same data.
Measure Values
Measure values are summaries calculated for measure data contained in the MultiDimensionalData object. The MultiDimensionalData.GetValue method results in the following values depending on the MultiDimensionalData object type:
- Grand Total for the MultiDimensionalData object with all the data displayed in the dashboard item
- Total for the slice by a single AxisPoint
- cell value for the intersection of several axis points. The method requires a measure whose values are summarized. A measure is specified as the method’s parameter as the MeasureDescriptor object. To obtain this object, call the MultiDimensionalData.GetMeasures method.
Tip
To calculate Totals which are not displayed in a dashboard item, such as Totals for data in the ChartDashboardItem, subscribe to the ConfigureItemDataCalculation event and set the CalculateAllTotals property to true.
Delta Values
Delta values are calculated for the following dashboard items:
- CardDashboardItem
- GaugeDashboardItem
- GridDashboardItem with a GridDeltaColumn
- ChoroplethMapDashboardItem
To obtain delta values, use the MultiDimensionalData.GetDeltaValue method. To obtain a required DeltaDescriptor, use the MultiDimensionalData.GetDeltas method.
The resulting DeltaValue object is a container for delta characteristics, such as Actual and Target values and others.
Note
You can obtain summary values for hidden measures using MultiDimensionalData.GetValue or MultiDimensionalData.GetDeltaValue methods.
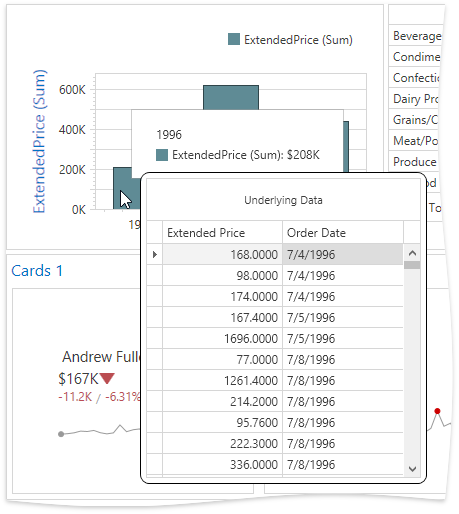
Underlying Data
The dashboard visualizes aggregated data from the underlying data source. You can obtain underlying data for a particular dashboard item using the DashboardViewer.GetUnderlyingData method. You can get all dashboard item’s data or a data set related to the specified AxisPoint. The resulting DashboardUnderlyingDataSet object implements the IBindingList interface and you can assign it to the GridControl.ItemSource property to display data in the Data Grid.
Events
The DashboardControl allows you to access underlying and client data when handling the following events:
- DashboardControl.DashboardItemMouseDoubleClick
- DashboardControl.DashboardItemMouseDown
- DashboardControl.DashboardItemMouseMove
- DashboardControl.DashboardItemMouseUp
You can obtain AxisPoints related to the element under the mouse pointer using the GetAxisPoint method. The (the GetUnderlyingData method gives you the underlying data for an element under the mouse pointer. The DashboardItemName event parameter contains the dashboard item’s component name.