Obtain Underlying and Displayed Data in ASP.NET Web Forms Dashboard Control
- 5 minutes to read
Important
This article describes the use of the legacy ASPxClientDashboard object. This object only partly replicates the API available in the client DashboardControl.
We recommend that you refer to the following topics instead:
- Obtain Underlying and Displayed Data is the related article for
DashboardControl. - Client-Side API Overview describes how to access the
DashboardControlinstance for ASP.NET Web Forms Dashboard control.
The Web Dashboard’s client API allows you to access two types of data:
- client data displayed within dashboard items
- underlying data from the dashboard data source
Client Data
The dashboard aggregates and visualizes data from the underlying data source (for instance, external databases or lists of data created at runtime).
Each data-bound dashboard item uses a multidimensional representation of data and aggregates underlying data based on dimensions. Measure and delta values are calculated at the intersection of these dimensions. Dashboard items visualize dimension values and corresponding measure/delta values.
Call the ASPxClientDashboard.GetItemData method to access a hierarchical representation of this data on the client.
Client Data Structure
The ASPxClientDashboardItemData object contains hierarchical data displayed within the dashboard item and provides access to the following objects.
- ASPxClientDashboardItemDataAxisPoint
- Stores points in a multidimensional space. A point is a dimension value that corresponds to a specific hierarchy level.
- ASPxClientDashboardItemDataAxis
- A data axis that contains a set of points. For instance, the pivot grid has the “Row” and “Column” data axes, the chart has the “Argument” and “Series” data axes, and so forth. The DashboardDataAxisNames class lists constants used to identify the data axis type.
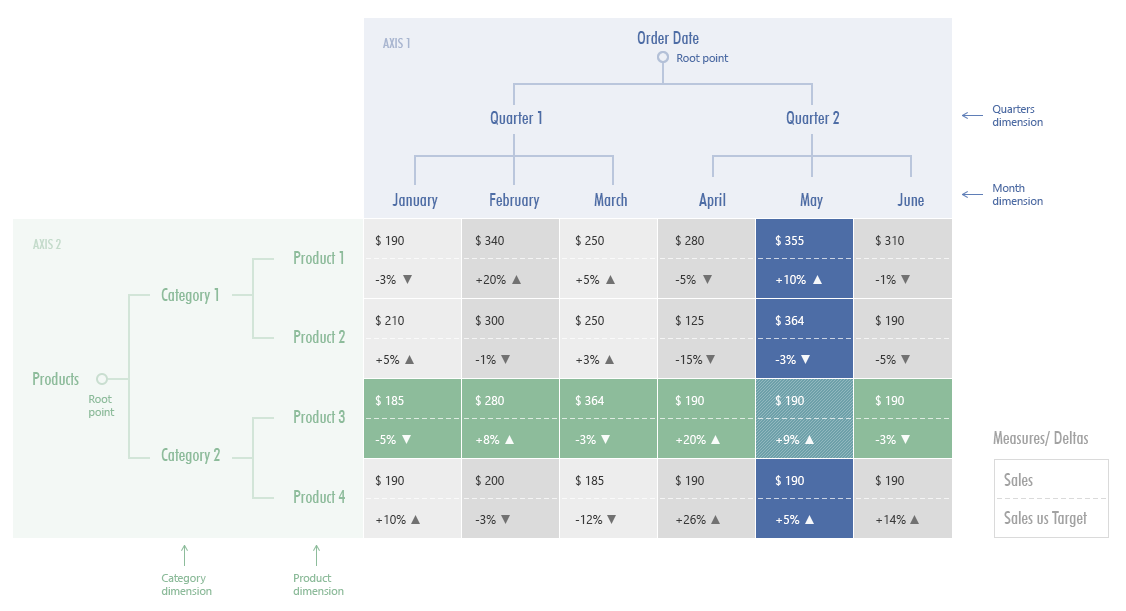
The image below shows how the ASPxClientDashboardItemData object stores hierarchical data:
Metadata
The ASPxClientDashboardItemData object allows you to obtain data member identifiers, formatting options, data item name, and other settings of dimensions and measures. Call the following ASPxClientDashboardItemData methods to get data items:
- GetDimensions
- Returns the dimensions that correspond to the specified axis.
- GetMeasures
- Returns measures.
- GetDeltas
- Returns information about deltas (for the Grid, Card, Gauge and Choropleth Map dashboard items).
Dimension Values
Obtain axis points placed on the data axis to access dimension values. For this, call the ASPxClientDashboardItemData.GetAxis method and pass the data axis name as a parameter. The returned ASPxClientDashboardItemDataAxis object exposes the ASPxClientDashboardItemDataAxis.GetPoints method that returns axis points belonging to the current axis.
Use the following ASPxClientDashboardItemDataAxisPoint methods to obtain dimension values for these axis points:
- GetValue
- Gets the value corresponding to the current axis point.
- GetDisplayText
- Gets the display text corresponding to the current axis point.
- GetUniqueValue
- Gets the unique value corresponding to the current axis point.
Slices
You can describe the slice of the ASPxClientDashboardItemData object as the ASPxClientDashboardItemDataAxisPointTuple instance that contains a set of axis points from different data axes. For this, call the ASPxClientDashboardItemData.GetSlice method and pass the point tuple as a parameter to get the slice of the current ASPxClientDashboardItemData object by the specified axis point.
Take a look at the image above again. The slice by the axis point corresponding to “Product 3” allows you to obtain summary values for all date intervals (horizontal area highlighted in green). The slice by the axis point corresponding to “May” contains summary values for all products (vertical area highlighted in blue).
Call the ASPxClientDashboardItemData.GetSlice method two sequential times to obtain the slice at the intersection of the “Product 3” and “May” axis points.
Measure Values
- Measure
You can obtain total summary values or summary values at the intersection of multiple axis points. For this, call the ASPxClientDashboardItemData.GetMeasureValue(measureId) method and pass the measure identifier (the ASPxClientDashboardItemDataMeasure.Id property value). You can get this identifier if you call the ASPxClientDashboardItemData.GetMeasures method.
For measure, you can get its value and display text. See the ASPxClientDashboardItemDataMeasureValue class member for details.
- Delta
To obtain delta values, use the ASPxClientDashboardItemData.GetDeltaValue(deltaId) method and pass the delta identifier (the ASPxClientDashboardItemDataDelta.Id property) as a parameter. Use the ASPxClientDashboardItemData.GetDeltas method to get delta identifiers.
For delta values, you can get actual/target values, various delta settings, and other multiple options. See the ASPxClientDashboardItemDataDeltaValue class member for details.
Note
You can use the ASPxClientDashboardItemData.GetMeasureValue method to obtain summary values for hidden measures.
Underlying Data
The dashboard visualizes aggregated data from the underlying data source.
Call the ASPxClientDashboard.RequestUnderlyingData method to obtain underlying data for a specific dashboard item or its elements.
Note that the RequestUnderlyingData method does not return data for calculated fields containing the Aggr function.
Events
The Web Dashboard control has events that allow you to obtain client and underlying data related to the clicked visual element. You can use this data to implement custom interactivity between dashboard items.
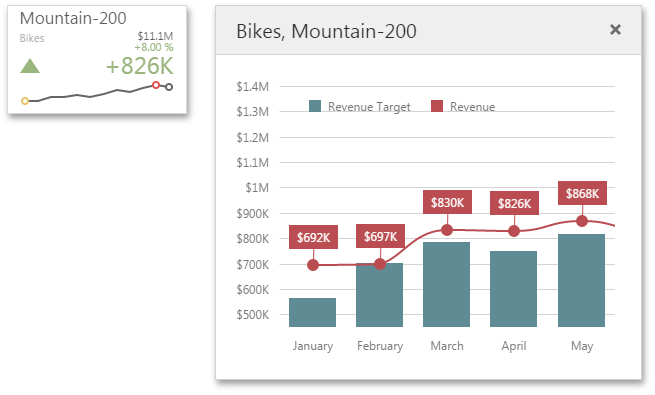
For instance, the chart series points in the image below are obtained based on the axis points placed on the DashboardDataAxisNames.SparklineAxis of the clicked card.
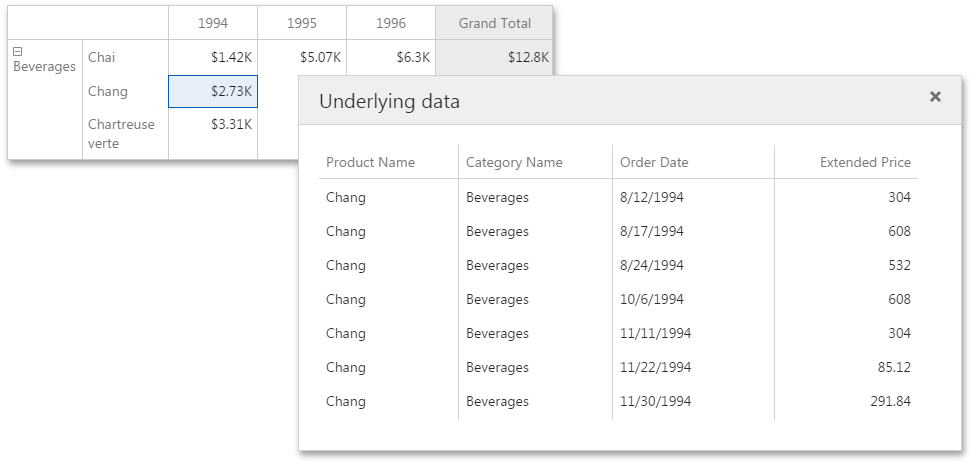
The grid in the image below displays underlying data related to the clicked pivot cell.
Handle the ASPxClientDashboard.ItemClick event to access underlying and client data.
In the event handler, you can use the following members to get data:
- e.GetAxisPoint
- Returns the axis point related to the clicked visual element.
- e.RequestUnderlyingData
- Returns underlying data that corresponds to the clicked visual element.
- e.ItemName
- Returns the component name of the dashboard item for which the event is raised.