Obtain Underlying and Displayed Data in the ASP.NET Web Forms Dashboard Control
- 5 minutes to read
Tip
This topic shows the ASP.NET Web Forms Dashboard Control’s specifics. The main concepts about underlying and displayed data are described in the following article: Obtain Underlying and Displayed Data in Dashboard Control for JavaScript Applications.
The Web Dashboard’s client API allows you to access two types of data: client data displayed within dashboard items and underlying data from the dashboard data source.
Client Data
The dashboard aggregates and visualizes data from the underlying data source (for instance, external databases or lists of data created at runtime).
Each data-bound dashboard item uses a multidimensional representation of data and aggregates underlying data based on dimensions. Measure and delta values are calculated at the intersection of these dimensions. Dashboard items visualize dimension values and corresponding measure/delta values.
Example: Obtain a Dashboard Item’s Client Data
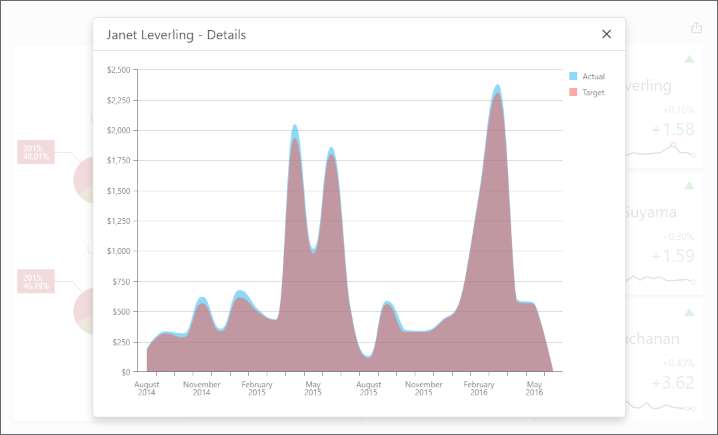
The following example uses the DashboardControl‘s client-side API to obtain client data that corresponds to a particular visual element. When you click a card, the dxChart displays the detailed chart and shows a variation of actual/target values over time.
Handle the DashboardControlOptions.onBeforeRender event to get access to the DashboardControl instance:
<%@ Page Language="C#" AutoEventWireup="true" CodeBehind="Default.aspx.cs" Inherits="ASPxDashboard_ClientData.Default" %>

<!DOCTYPE html>

<html>
<head runat="server">
    <title></title>
    <script src="Scripts/ClientData.js"></script>
    <!-- ... -->
</head>
<body>
    <form id="form1" runat="server">
        <div id="myPopup"></div>
        <dx:ASPxDashboard ID="ASPxDashboard1" runat="server"
            WorkingMode="Viewer" Width="100%" Height="100%" DashboardStorageFolder = "~/App_Data/Dashboards">
            <ClientSideEvents BeforeRender="onBeforeRender"/>
        </dx:ASPxDashboard>
    </form>
</body>
</html>
The ViewerApiExtensionOptions.onItemClick event is handled to obtain client data and invoke the dxPopup component with the dxChart.
In the event handler, the e.getData method call obtains the dashboard item’s client data. The e.getAxisPoint method returns the axis point corresponding to the clicked card while the ItemData.getSlice method returns the slice of client data by this axis point.
The ItemDataAxis.getPoints method is used to obtain axis points that belong to the “Sparkline” data axis. Call the ItemData.getDeltaValue method to obtain corresponding actual/target values:
function onBeforeRender(sender) {
    var dashboardControl = sender.GetDashboardControl();

    var viewerApiExtension = dashboardControl.findExtension('viewerApi');
    if (viewerApiExtension)
        viewerApiExtension.on('itemClick', onItemClick);

    $("#myPopup").dxPopup({
        width: 800, height: 600,
        title: "Details",
        showCloseButton: true
    });
}

function onItemClick(args) {
    if (args.itemName == "cardDashboardItem1") {
        var clientData = [],
            clientDataTable = [],
            clickedItemData,
            delta;
        var sparklineAxis = "Sparkline",
            defaultAxis = "Default";

        clientData = args.getData();
        clickedPoint = args.getAxisPoint(defaultAxis);
        clickedItemData = clientData.getSlice(clickedPoint);
        delta = args.getDeltas()[0];

        for (var i = 0; i < clickedItemData.getAxis(sparklineAxis).getPoints().length; i++) {
            var dataTableRow = {},
            axisPoint = clickedItemData.getSlice(clickedItemData.getAxis(sparklineAxis).getPoints()[i]);

            dataTableRow["Argument"] = clickedItemData.getAxis(sparklineAxis).getPoints()[i].getValue();
            if (axisPoint.getDeltaValue(delta.id).getActualValue().getValue() != null &&
                axisPoint.getDeltaValue(delta.id).getTargetValue().getValue() != null) {
                dataTableRow["Actual"] = axisPoint.getDeltaValue(delta.id).getActualValue().getValue();
                dataTableRow["Target"] = axisPoint.getDeltaValue(delta.id).getTargetValue().getValue();
            }
            else {
                dataTableRow["Actual"] = 0;
                dataTableRow["Target"] = 0;
            }
            clientDataTable.push(dataTableRow);
        }

        var $chart = $('<div/>');
        $chart.dxChart({
            height: 500,
            dataSource: clientDataTable,
            series: [{
                valueField: 'Actual', name: 'Actual'
            }, {
                valueField: 'Target', name: 'Target'
            }
            ],
            commonSeriesSettings: {
                type: 'splineArea',
                argumentField: 'Argument',
                ignoreEmptyPoints: true
            },
            argumentAxis: {
                showZero: false,
                type: 'discrete'
            },
            valueAxis: {
                showZero: false,
                type: 'continuous',
                label: { format: 'currency' }
            }
        });

        var popup = $("#myPopup").data("dxPopup");
        popup.option('title', clickedPoint.getValue() + " - Details");
        $popupContent = popup.content();
        $popupContent.empty();
        $popupContent.append($chart);
        popup.show();
    };
}
Underlying Data
The dashboard visualizes aggregated data from the underlying data source.
Call the ViewerApiExtension.requestUnderlyingData method and pass axis points or data members as parameters to obtain underlying data for a specific dashboard item or its elements.
Note
The requestUnderlyingData method returns only non-aggregated data values.
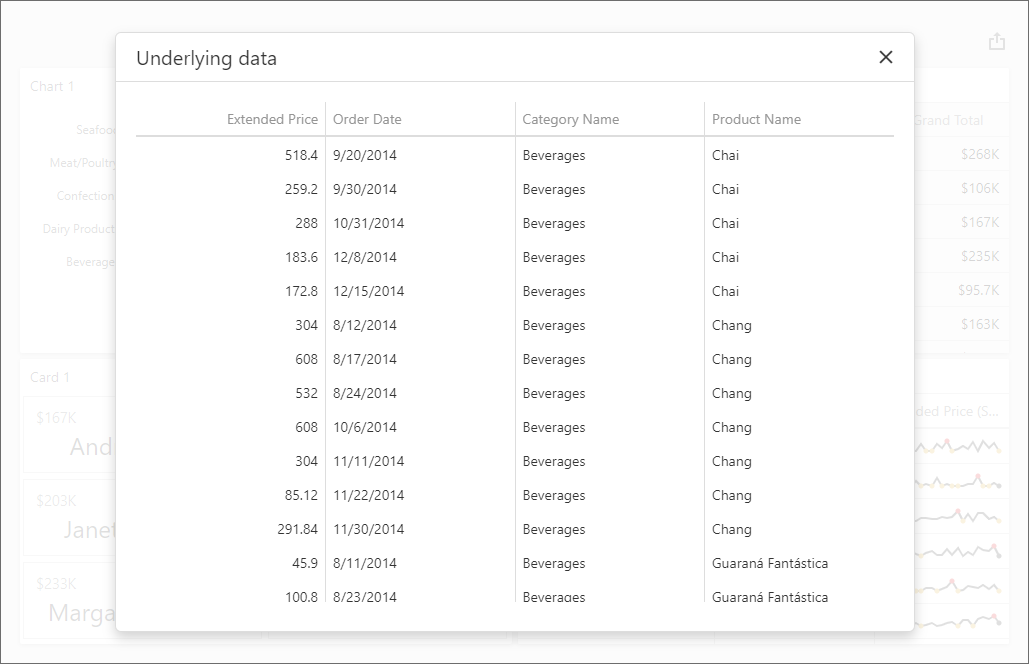
Example: Obtain a Dashboard Item’s Underlying Data for a Clicked Visual Element
This example gets underlying data that corresponds to a particular visual element and displays this data in the dxPopup widget with the child dxDataGrid.
Handle the DashboardControlOptions.onBeforeRender event to get access to the DashboardControl instance:
<%@ Page Language="C#" AutoEventWireup="true" CodeBehind="WebForm1.aspx.cs" Inherits="ASPxDashboard_UnderlyingData.WebForm1" %>

<!DOCTYPE html>

<html>
<head runat="server">
    <title></title>
    <script src="Scripts/UnderlyingData.js"></script>
</head>
<body>
    <form id="form1" runat="server">
        <div id="myPopup"></div>
        <div style="position:absolute; left:0; right:0; top:0; bottom:0;">
            <dx:ASPxDashboard ID="ASPxDashboard1" runat="server"
                WorkingMode="Viewer" Height="100%" Width="100%" DashboardStorageFolder = "~/App_Data/Dashboards">
                <ClientSideEvents BeforeRender="onBeforeRender" />
            </dx:ASPxDashboard>
        </div>
    </form>
</body>
</html>
Handle the ViewerApiExtensionOptions.onItemClick event and call the ViewerApiExtension.requestUnderlyingData method to get the underlying data:
function onBeforeRender(sender) {
    var dashboardControl = sender.GetDashboardControl();

    var viewerApiExtension = dashboardControl.findExtension('viewerApi');
    if (viewerApiExtension)
        viewerApiExtension.on('itemClick', onItemClick);

    $("#myPopup").dxPopup({
        width: 800, height: 600,
        title: "Underlying data",
        showCloseButton: true
    });
}

function onItemClick(args) {
    var underlyingData = [];

    args.requestUnderlyingData(function (data) {
        dataMembers = data.getDataMembers();
        for (var i = 0; i < data.getRowCount() ; i++) {
            var dataTableRow = {};
            $.each(dataMembers, function (_, dataMember) {
                dataTableRow[dataMember] = data.getRowValue(i, dataMember);
            });
            underlyingData.push(dataTableRow);
        }

        var $grid = $('<div/>');
        $grid.dxDataGrid({
            height: 500,
            scrolling: {
                mode: 'virtual'
            },
            dataSource: underlyingData
        });

        var popup = $("#myPopup").data("dxPopup");
        $popupContent = popup.content();
        $popupContent.empty();
        $popupContent.append($grid);
        popup.show();
    });
}
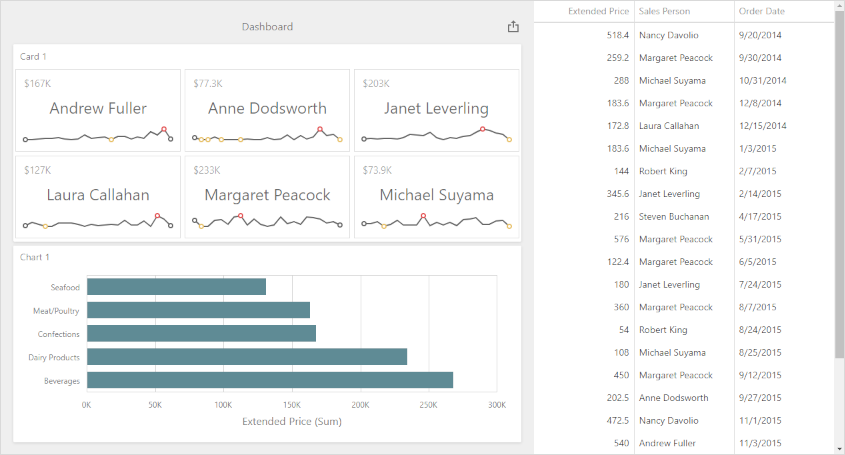
Example: Obtain Underlying Data for the Specified Dashboard Item
The example shows how to get underlying data for the specified dashboard item. Underlying data is displayed in the dxDataGrid widget placed next to the Web Dashboard.
Example: Obtain a Custom Item’s Underlying Data for a Clicked Visual Element
This example shows how to obtain underlying data in a custom dashboard item when a user clicks the item’s visual element. The custom item is based on the Funnel D3 item.