Manage Interactivity Capabilities
- 4 minutes to read
You can use the Master Filtering and Drill-Down features to enable interaction between various dashboard items. You can also provide custom visual interactivity for data-bound dashboard items that support element selection and highlighting using the DashboardViewer.DashboardItemVisualInteractivity event.
Master Filtering
For details on how to apply filtering using a specific dashboard item, refer to the Master Filtering topic in this item’s Interactivity section.
The DashboardViewer.CanSetMasterFilter method allows you to determine whether master filtering can be applied to the specified dashboard item. Use the DashboardViewer.GetAvailableFilterValues method to obtain axis point tuples that identify elements which can be selected in the master filter item’s current state. The DashboardViewer.GetEntireRange method returns the specified Range Filter dashboard item’s visible range.
To apply filtering in code, use the DashboardViewer.SetMasterFilter method (or DashboardViewer.SetRange method for the Range Filter dashboard item).
The DashboardViewer.MasterFilterSet event is raised after filtering is applied or the master filter item’s state changed. Its MasterFilterSetEventArgs.SelectedValues and MasterFilterSetEventArgs.SelectedRange properties allow you to obtain the currently selected values or the selected range of the dashboard item that causes the event.
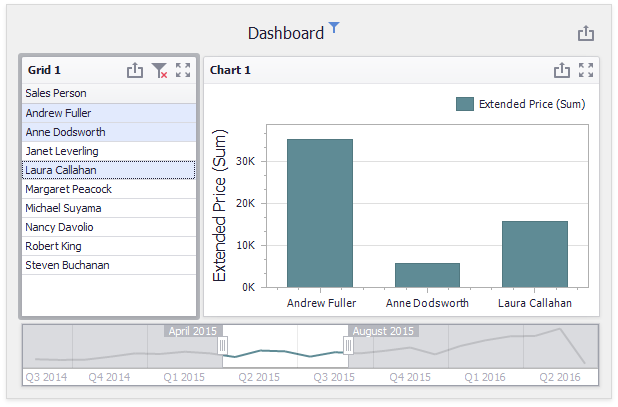
For instance, for the dashboard in the image above, the MasterFilterSetEventArgs.SelectedValues property returns “Andrew Fuller”, “Ann Dodsworth” and “Laura Callahan” for the Grid dashboard item. For the Range Filter dashboard item, the MasterFilterSetEventArgs.SelectedRange property returns minimum and maximum values in the selected range (“March, 1997” and “October, 1997”, respectively).
To clear the selection in the Master Filter item, use the DashboardViewer.ClearMasterFilter method.
After the selection is cleared, the DashboardViewer.MasterFilterCleared event is raised.
How to: Apply Default Filtering to Master Filters in DashboardViewer
How to: Apply Master Filtering in DashboardViewer
How to: Apply Master Filtering in Code in OLAP Mode
Drill-Down
To learn how end-users can drill down using a particular dashboard item, refer to this item’s Drill-Down topic in the Interactivity section.
The DashboardViewer.GetAvailableDrillDownValues method allows you to obtain values that can be used to perform drill-down.
To perform drill-down/drill-up in code, use the DashboardViewer.PerformDrillDown/DashboardViewer.PerformDrillUp methods.
After drill-down (or drill-up) is performed, the DashboardViewer.DrillDownPerformed (or DashboardViewer.DrillUpPerformed) event is raised.
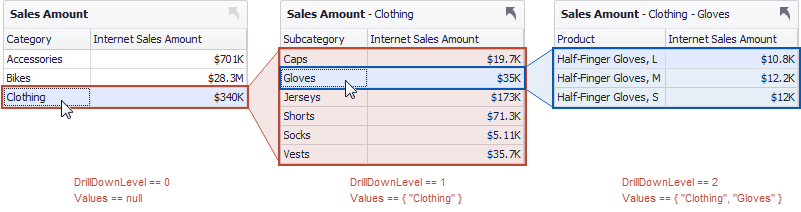
You can use the DrillActionEventArgs.DrillDownLevel event parameter to determine the current drill-down level.
The DrillActionEventArgs.Values property allows you to obtain values from the current drill-down hierarchy.
How to: Perform a Drill-Down in DashboardViewer
Custom Interactivity
The DashboardViewer allows you to provide custom visual interactivity for data-bound dashboard items that support element selection and highlighting using the DashboardViewer.DashboardItemVisualInteractivity event. This event is raised for dashboard items with disabled master filtering. Visual interactivity for master filter items are enabled by default. The DashboardViewer also fires this event when master filtering is applied to the current dashboard item.
Note
Note that the DashboardViewer.DashboardItemVisualInteractivity event is raised on the bottommost drill-down level for dashboard items with drill-down enabled.
Use the DashboardItemVisualInteractivityEventArgs.DashboardItemName event parameter to obtain the name of the dashboard item for which the event was raised.
The DashboardItemVisualInteractivityEventArgs.TargetAxes property allows you to specify data axes used to perform custom interactivity actions (selection of grid rows, selection and highlighting of chart series points, etc.). The DashboardItemVisualInteractivityEventArgs.Data event parameter returns the MultiDimensionalData object whose members allow you to obtain the available data axes.
To specify the selection mode and manage highlighting, use the DashboardItemVisualInteractivityEventArgs.SelectionMode and DashboardItemVisualInteractivityEventArgs.EnableHighlighting properties respectively. The DashboardItemVisualInteractivityEventArgs.SetDefaultSelection method provides the capability to specify the default selection for the current dashboard item.
After the selection is changed, the DashboardViewer.DashboardItemSelectionChanged event is raised. Its DashboardItemSelectionChangedEventArgs.CurrentSelection parameter returns the selected elements.
The following table lists possible target axes for each dashboard item and supported interactivity capabilities:
Dashboard Item | Target Axes | Selection | Highlighting |
|---|---|---|---|
| |||
|
| ||
|
| ||
|
| ||
|
| ||
|
| ||
| |||
|
|

Note
Note that the Grid dashboard item does not support custom interactivity when Cell Merging is enabled.
How to: Add Custom Interactivity to a Dashboard Displayed in the WinForms Viewer