Map Coloring
- 4 minutes to read
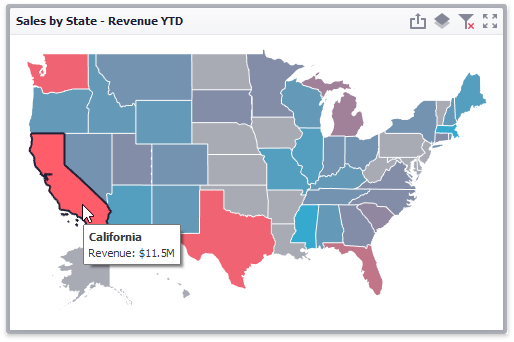
The Choropleth Map dashboard item colors map shapes depending on the provided values.
For instance, you can visualize a sales amount or population density.
Palette and Scale Settings
The Choropleth Map automatically selects palette and scale settings to color map shapes.
If you need to customize these settings, click the Options button next to the data item that contains these values.
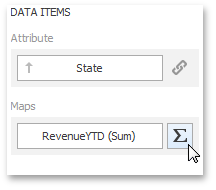
This invokes the Choropleth Map Options dialog.
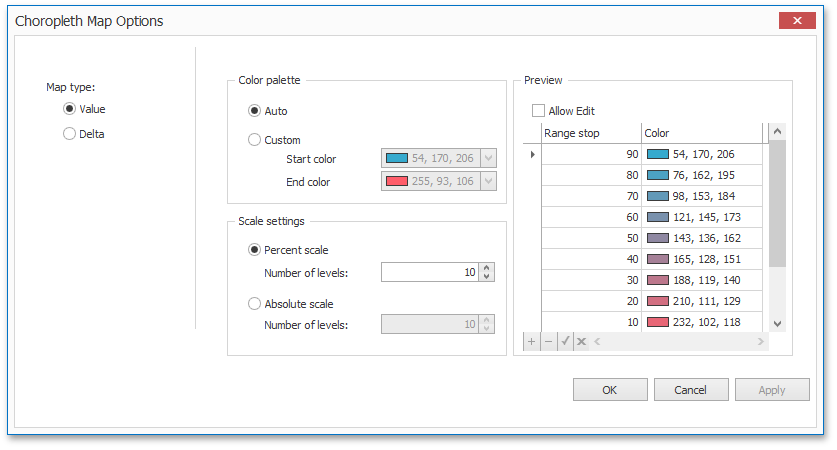
You can specify the following settings in this window.
Color palette - allows you to specify the start and end color of the palette.
To specify these colors in code, create a GradientPalette object, specify its GradientPalette.StartColor and GradientPalette.EndColor properties and assign this object to the ValueMap.Palette property.
Scale settings - specifies whether a percent scale or an absolute scale is used to define a set of colors. You can specify the number of levels that represent the number of colors used to color the map.
To specify the number of levels in code, create a UniformScale object, set the UniformScale.LevelsCount property and assign this object to the ValueMap.Scale property.
Preview is used to display a full set of palette colors generated based on the start/end colors and the number of levels. Use the Allow Edit check box to automatically change the generated colors or specify value ranges for each color.
To specify a custom palette in code, create a CustomPalette object, add the required colors to the CustomPalette.Colors collection and assign this object to the ValueMap.Palette property.
To specify endpoints for color ranges, use the CustomScale.RangeStops property.
To learn how to display a map legend, see Legend.
Also, the Choropleth Map allows you to visualize the difference between the actual and target values of a particular parameter. To learn more, see the Delta topic.
Example
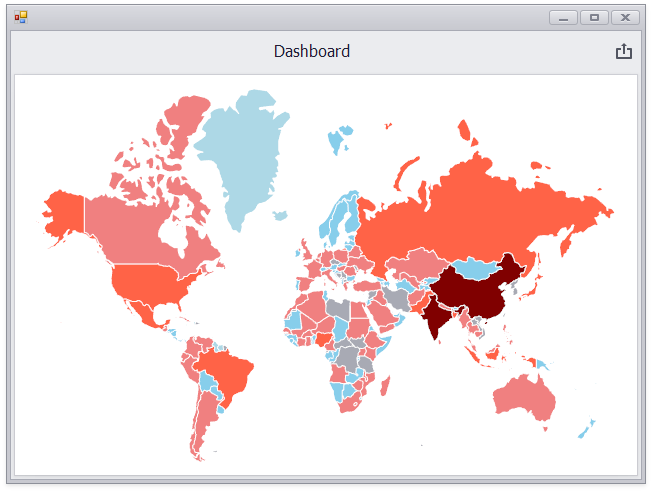
The following code snippets demonstrate how to customize a palette of the Choropleth map.
In this example, a set of custom colors is used to color map shapes depending on the provided values. Absolute values are used to specify endpoints for color ranges.
using System.Collections.Generic;
using System.Drawing;
using DevExpress.DashboardCommon;
using DevExpress.XtraEditors;

namespace Dashboard_ChoroplethMapCustomPalette {
    public partial class Form1 : XtraForm {
        public Form1() {
            InitializeComponent();
            // Loads a dashboard that contains a choropleth map with the default palette.
            Dashboard dashboard = new Dashboard();
            dashboard.LoadFromXml(@"..\..\Data\Dashboard.xml");

            // Gets the ValueMap object that provides data for coloring map shapes.
            ChoroplethMapDashboardItem map = (ChoroplethMapDashboardItem)dashboard.Items[0];
            ValueMap populationMap = (ValueMap)map.Maps[0];

            // Creates CustomPalette and CustomScale objects.
            CustomPalette customPalette = new CustomPalette();
            CustomScale customScale = new CustomScale();

            // Creates lists of custom colors and range stops.
            List<Color> customColors = new List<Color>();
            List<double> rangeStops = new List<double>();

            // Specifies that the absolute scale is used to define a set of colors.
            customScale.IsPercent = false;

            // Specifies custom colors and corresponding range stops.
            customColors.Add(Color.LightBlue);  rangeStops.Add(100000);
            customColors.Add(Color.SkyBlue);    rangeStops.Add(1000000);
            customColors.Add(Color.LightCoral); rangeStops.Add(10000000);
            customColors.Add(Color.Tomato);     rangeStops.Add(100000000);
            customColors.Add(Color.Maroon);     rangeStops.Add(1000000000);

            // Adds custom colors and range stops to a custom palette and corresponding custom scale.
            customPalette.Colors.AddRange(customColors);
            customScale.RangeStops.AddRange(rangeStops);

            // Specifies a custom palette and scale for the ValueMap object.
            populationMap.Palette = customPalette;
            populationMap.Scale = customScale;

            // Sets the customized dashboard as a currently opened dashboard.
            dashboardViewer1.Dashboard = dashboard;
        }
    }
}