Create a Dashboard in Visual Studio
- 3 minutes to read
This tutorial shows how to create a dashboard at design time within Visual Studio and display this dashboard in the WPF Dashboard Viewer.
- Steps 1-3. Add a Dashboard to the Project
- Steps 3-12. Connect to a Database and Select Data
- Steps 13-16. Add Dashboard Items and Bind them to Data
Note
Watch the video: DevExpress Dashboards: Visual Studio IDE Integration
Steps 1-3. Create a New Project and Add a Dashboard
Right-click the project in the Solution Explorer and select Add DevExpress Item | New Item…. The DevExpress Template Gallery wizard starts. Select the WPF platform and the Dashboard item, as shown below:
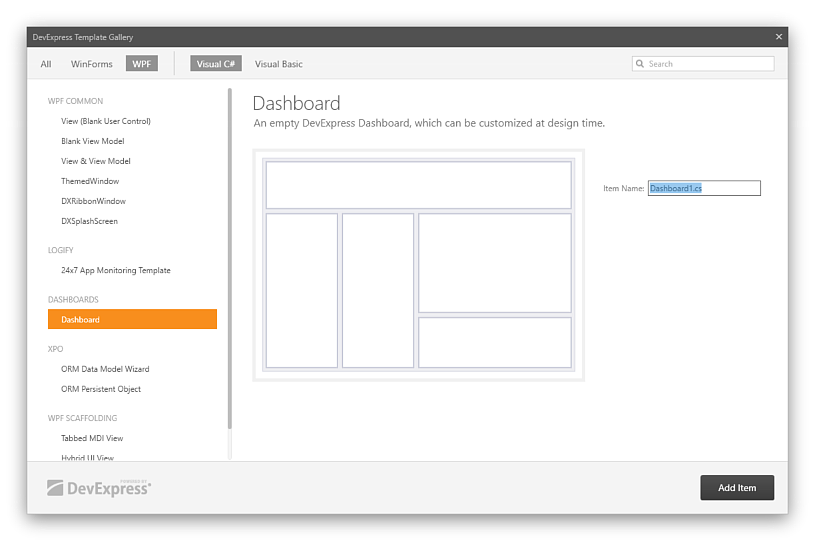
- Click Add Item. If you do not specify a name, a new file with the default name Dashboard1.cs is added to the project.
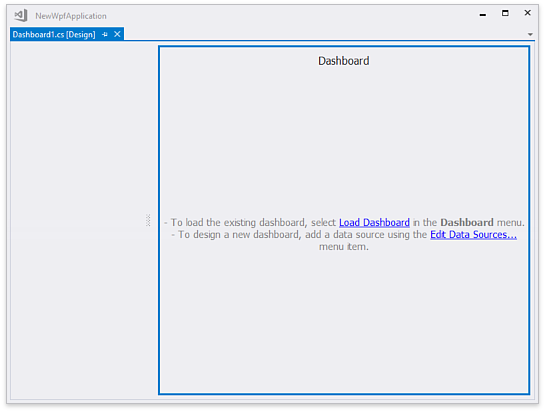
Double-click the file in the Visual Studio Solution Explorer to display the designer for the newly created dashboard.
Steps 3-12. Connect to a Database and Select Data
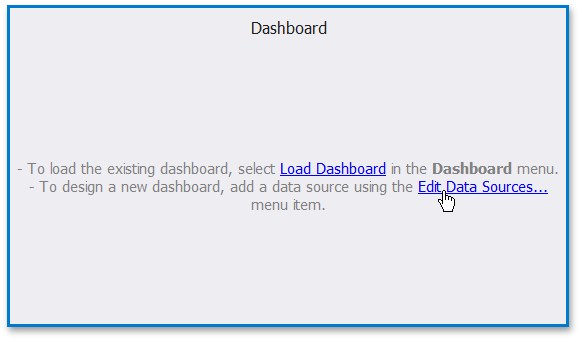
To add a dashboard data source, click Edit Data Sources… on the dashboard surface.
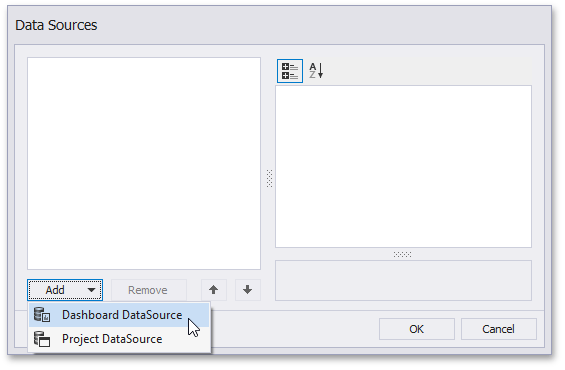
Click Add | Dashboard Data Source to add a new data source in the invoked Data Sources dialog.
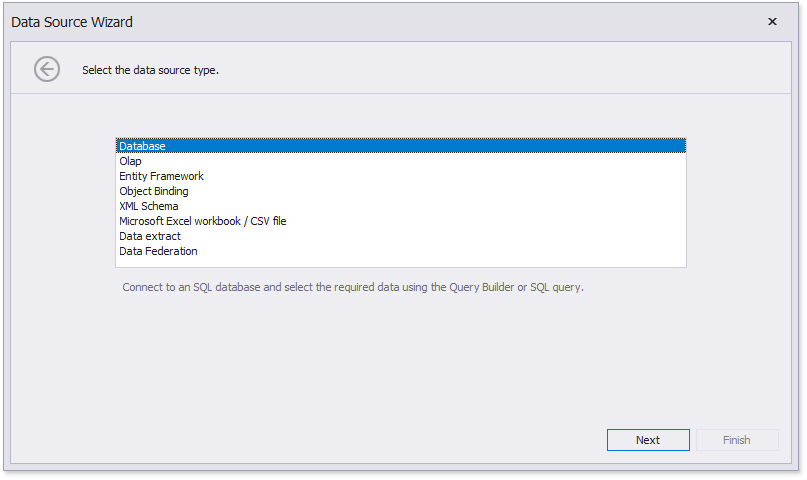
On the first Data Source page, select Database and click Next.
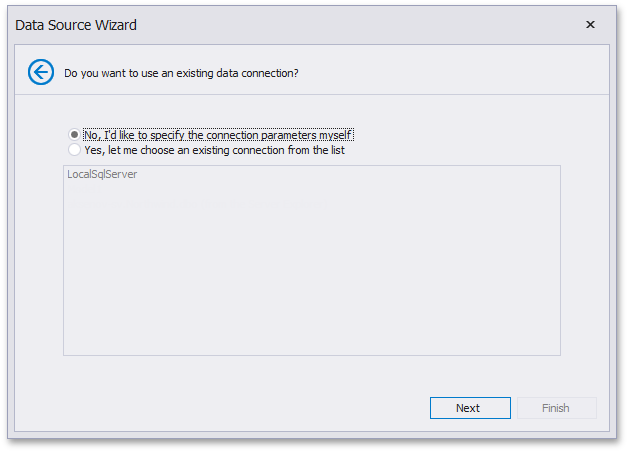
On the next page, select No, I’d like to specify the connection parameters myself and click Next.
Now specify the data connection parameters. Select the Microsoft Access 97 data provider and specify the database path in the Database field:
C:\Users\Public\Documents\DevExpress Demos 19.1\Components\Data\nwind.mdb
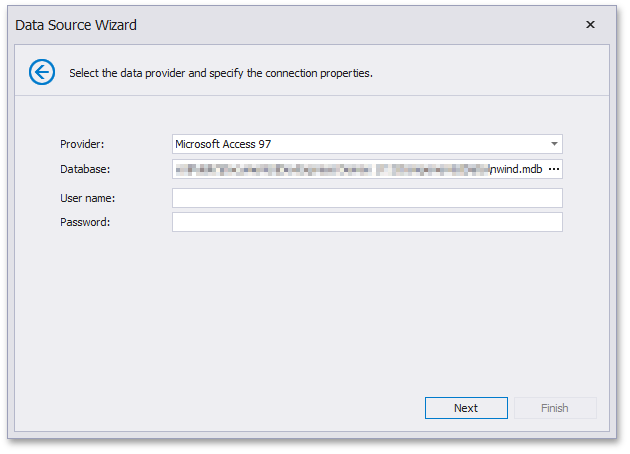
Click Next.
On the next page, leave the default settings and click Next.
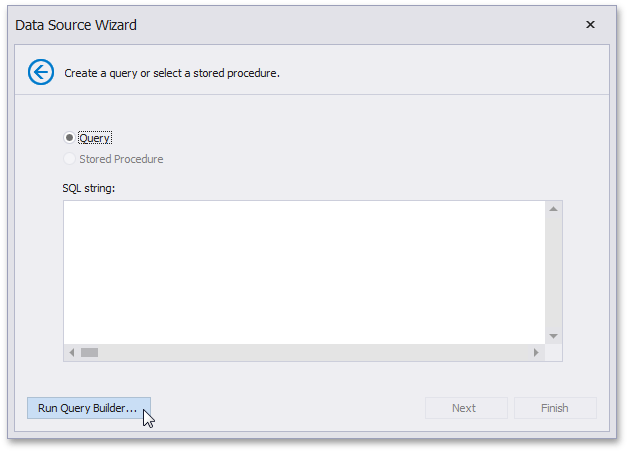
At the final page, click the Run Query Builder… button to run the Query Builder and select the required data.
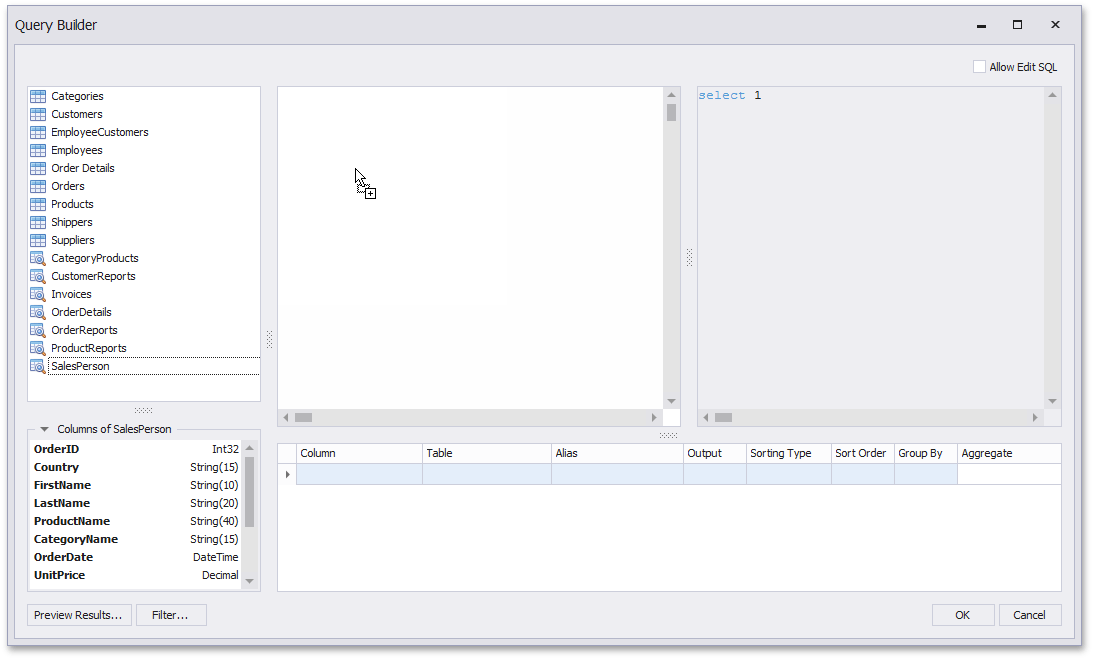
In the invoked Query Builder, drag and drop the SalesPerson view from the Tables pane onto the Design pane…
…and check the (All Columns) checkbox.
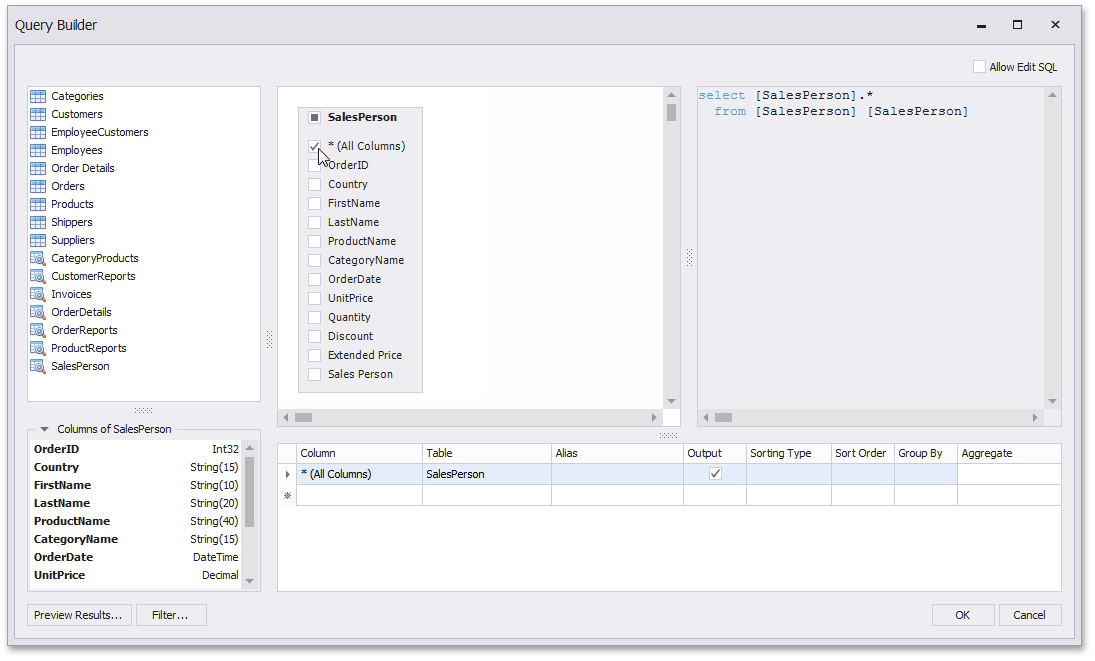
Click OK.
The Data Source Wizard displays the generated query.
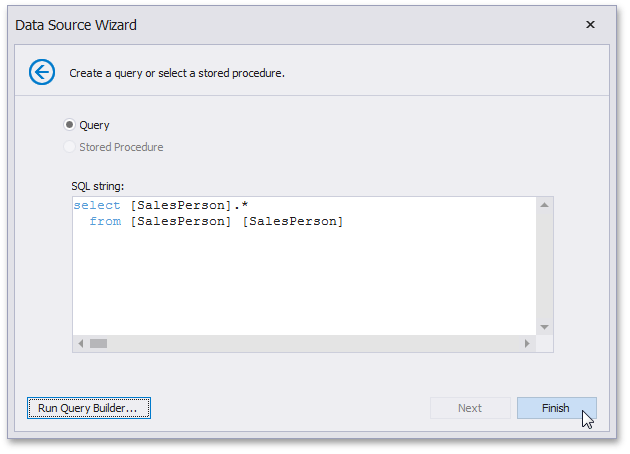
Click Finish to create the data source.
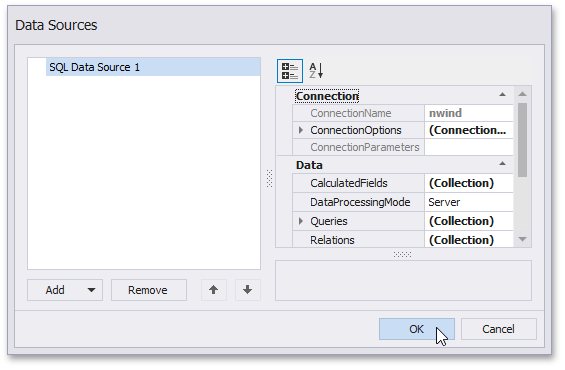
The Data Sources dialog displays the created data source and its properties. Click OK.
Steps 13-16. Add Dashboard Items and Bind them to Data
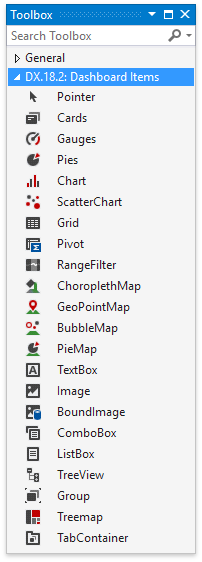
To add dashboard items, open the Toolbox and drag them onto the dashboard.
First, add the Gauge dashboard item to the dashboard. Select Dashboard | Field List and drag the Extended Price field onto the “Actual” placeholder in the Gauges section.
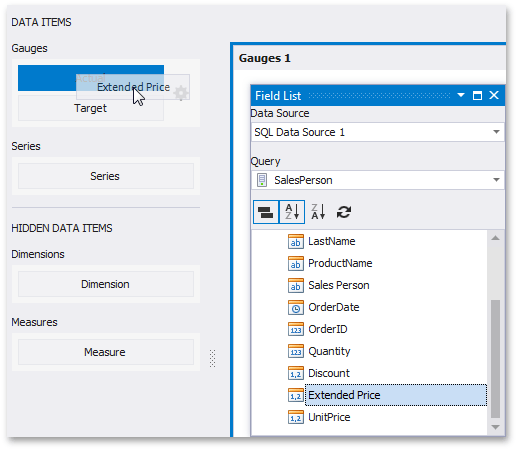
Then, drag the Country field to the Series section.
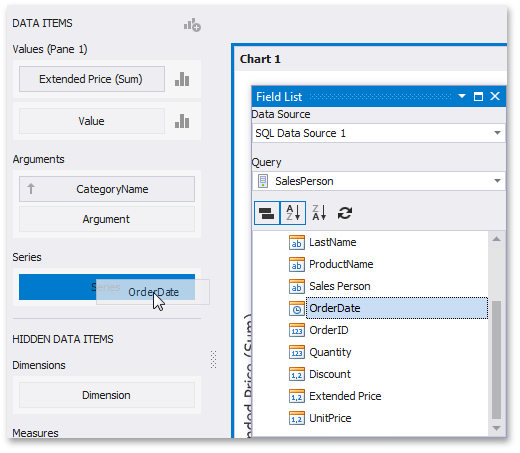
Add the Chart to the dashboard and drag the Extended Price field onto the Values section, the CategoryName field onto the Arguments section and the OrderDate field onto the Series section.
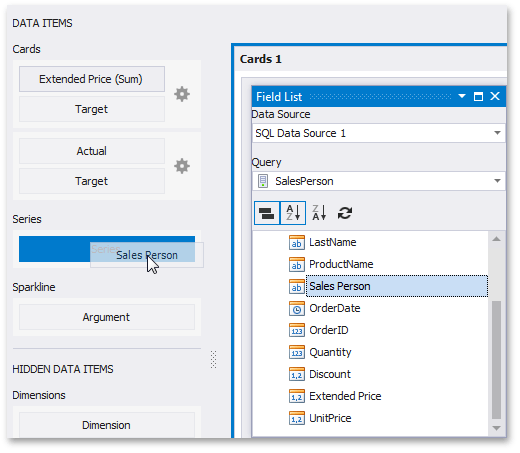
Finally, add the Cards dashboard item. Drag the Extended Price field onto the “Actual” placeholder in the Cards section and place the Sales Person field in the Series section.
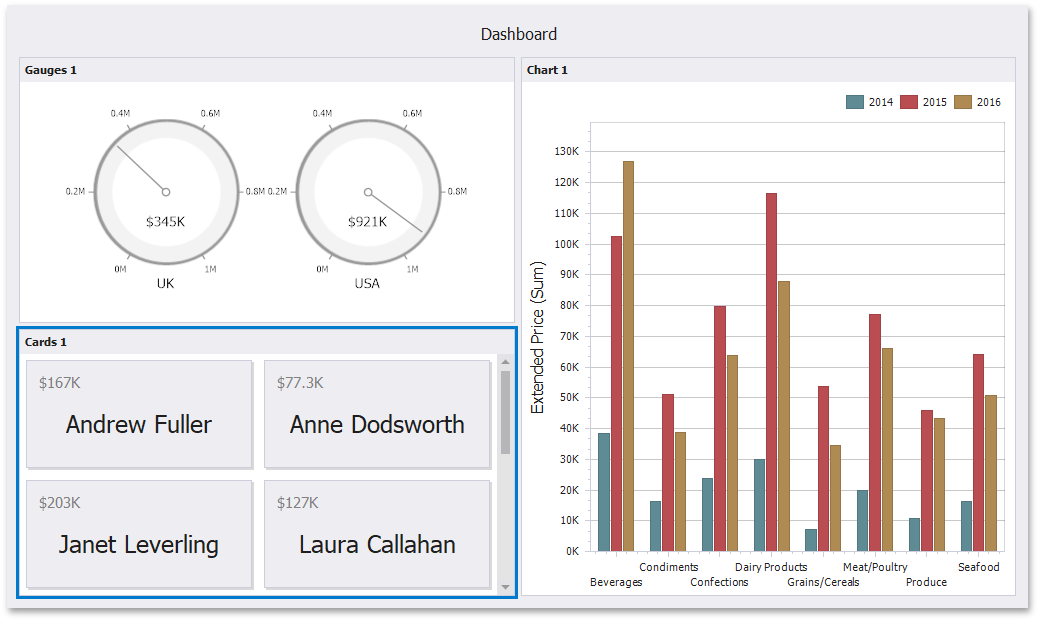
The dashboard should look as follows in Visual Studio:
Next Steps
Create Dashboards in the Visual Studio Designer
Describes how to create and configure dashboards in the Visual Studio Designer.