Bind Dashboard Items to Data in OLAP Mode
In OLAP mode, the cube schema is fetched automatically, and the Data Source Browser displays the entire OLAP cube structure.
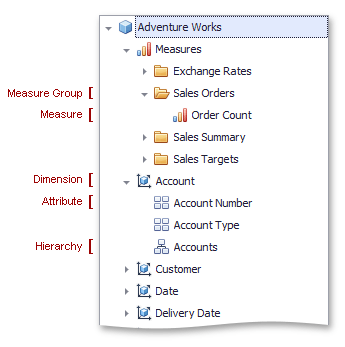
To visualize data, drag and drop measures, attributes or hierarchies to appropriate data sections in the DATA ITEMS pane as described in the Bind Dashboard Items to Data in the Designer topic.
Note that OLAP measures can be placed only in the Values section, while dimension attributes and hierarchies can be placed within other data sections.
Note
By default, the dashboard displays only dimension values that have intersections with measures in a cube. To show all available dimension values, add hidden measures to a dashboard item so that all dimension values will have at least one measure value.
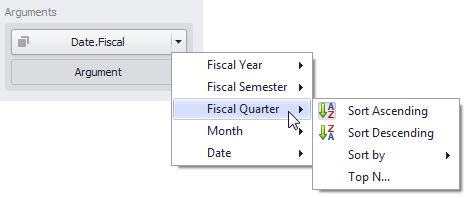
OLAP hierarchies allow you to customize each level separately. To access hierarchy level options, invoke the data item menu for a hierarchy and then use the submenu that corresponds to the desired level.
For more information refer to the OLAP Mode Limitations topic.